HTML
-
The spatial distribution of population is a social and economic phenomenon, and the manifestation of the population development process in geographical space (Zhu, 1980). Combinations of physical, social, political, and historical drivers introduce variation into the spatial distribution of human populations (Pozzi et al., 2003; Patterson and Doyle, 2011). Knowing how these factors influence where people are located is important in understanding how and why population distributions change over time (Small and Cohen, 2004). Many researches have been carried out on population distribution patterns at different levels, including internationally, by country, by region, and by city (Hu, 1935; Sun, 1982; Tobler et al., 1997; Zhang, 1999; Zhou et al., 2004; Ge and Feng, 2008; Liu et al., 2010; Franklin, 2012; Ji et al., 2014; Qi et al., 2020), on changes in those patterns (Feng and Zhou, 2003), on the factors affecting them, on population predictions (Zhang, 1996; Dong et al., 2002; Li and Zhang, 2006; Feng et al., 2007; Li et al., 2009; Wang and Wu, 2011; Wang et al., 2014; You et al., 2014) and on the simulation of population distribution (Gao and Wu, 2005). One current example of a global change in spatial population distribution is the accelerating trend toward urbanization (Tobler et al., 1997) with an overall increase in the population located near the coast (Small and Cohen, 2004).
Reliable information on population distribution has been identified as key to a better understanding of human impacts on land and water resources (Tian et al., 2005; Zhang et al., 2015), and is essential for assessing human pressure on the surrounding environment and human vulnerability to environmental change (Small and Cohen, 2004; Yang et al., 2012), compiling regional development plans, and guiding rational population flow. As a result, this information is widely applied in both the science and policy domains (Briggs et al., 2007). Compared with the census data provided by traditional administrative units, raster population density data offers more reliable information on population distribution (Hay et al., 2005; Liu et al., 2006; Langford et al., 2008). Dasymetric mapping decomposes the population of census spatial units by using land cover (Tian et al., 2004; Tian et al., 2005; Viel and Tran, 2009; Gallego, 2010; Linard et al., 2010), night light (Sutton, 1997; Dobson et al., 2000; Sutton et al., 2001; Briggs et al., 2007; Zhuo et al., 2009), image texture index (Chen, 2002), and other clear auxiliary information (Langford et al., 2008). It also allocates statistical population data to a regular grid of a certain scale, taking administrative region as its unit, in order to generate detailed population data of spatial pattern (Tian et al., 2005; Gallego, 2010), which lays a foundation for research on the coupling process of the interaction between nature and society (Kates et al., 2001).
Hypsographic demography, developed by Cohen and Small (1998), studies the relationship between population and altitude, and uses an alternative reference framework for the spatial distribution of population. It alters the traditional framework for assessing human population distribution across a flat, two-dimensional landscape with uncertain elevation (Patterson and Doyle, 2011), and connects population with the altitude of a specific point, so that the population distribution can be calculated according to the altitude (Cohen and Small, 1998; Patterson and Doyle, 2011). Studies have quantitatively demonstrated the decisive role of topography in the spatial distribution pattern of population at the level of the world (Cohen and Small, 1998), climate region (Small and Cohen, 2004), watershed (You et al., 2014), country (Bajat et al., 2011), state (Patterson and Doyle, 2011), province (Qi et al., 2020) and even county (Patterson and Doyle, 2011). The global population is mainly concentrated in low-altitude areas (Cohen and Small, 1998). In 1994, about 1.88 × 10⁹ people (accounting for 33.5% of the world’s population) lived less than 100 meters above sea level (Cohen and Small, 1998). With an increase in altitude, the number of people decreases more than exponentially (Cohen and Small, 1998). In the tropics, altitude and fertile soil associated with volcanic areas can encourage agricultural populations to settle near potentially active volcanoes (Small and Naumann, 2001). In the Lancang-Mekong River Basin, the total population decreases exponentially as the elevation increases (You et al., 2014), as it does in China (Zhang, 2003). In China’s land border areas, the population density decreases as the altitude increases (Wang and Wu, 2011). In North Carolina, the population density varies with altitude (Patterson and Doyle, 2011). Other topographic factors derived from altitude, such as slope, aspect, and topographic relief, affect human habitation and thus population distribution (Feng et al., 2007; Wang and Wu, 2011). Due to the controlling role of terrain in population distribution, some scholars also regard altitude as an influencing factor in the spatial simulation of population (Yue et al., 2003; Zhao et al., 2020).
Altitude is the most basic geometric quantity for expressing the undulating shape of the Earth’s surface, and the role of topography in China’s population distribution has received much attention. Sun (1982) and Zhang (1996) observed that plain and hilly areas less than 500 m above sea level account for 28% of China’s total land area and 74% of its total population; the population of plain areas below 200 m account for approximately 50% of the whole country; areas with an altitude over 2000 m account for about a quarter of the total area of the country; and at more than 3000 m above sea level, the proportion of the population is less than 1%, and cities and residential areas are scarce (Sun, 1982). Zhang (2003) calculated the average population density in different elevation ranges from the perspective of altitude, and derived the rule that the average population changes in an inverted exponential distribution. Zhang (1996) analyzed the vertical distribution and discussed the optimal distribution of population in mountainous areas. Ge and Feng (2008) studied the correlation between topographic relief and population distribution on a national scale, and identified significant regional differences in the correlation between the two factors.
Terrain condition is one of the main factors that affect regional population distribution and social and economic development (Feng et al., 2011). For mountainous areas, differences in terrain elevation and undulation are the core factors affecting the spatial pattern of the population (Jing et al., 2020). Zhou et al. (2012) and Jing et al. (2020) explored the relationship between topographic relief and population distribution in the Guanzhong-Tianshui Economic Zone and the Qinba Mountain Area, respectively, concluding that topographic relief is one of the most important factors affecting population distribution. In the Qinba Mountain Area, terrain is also the leading factor in the relative poverty of the region (Zhou et al., 2015). At the provincial and regional levels, the population density of different geomorphic units varies widely. For example, more than 60% of the population in Shaanxi Province is concentrated on the Guanzhong Plain, which accounts for 19% of the total area of the province (Liu and Ren, 2012). The densely populated areas in Shandong Province are concentrated in the southwest plain (Lin and Xia, 2017). Terrain factors in the Beijing-Tianjin-Hebei Metropolis restrict the distribution of the population, but the intensity of the restriction varies by region, with a greater impact on the northern and southern regions and a smaller impact on the central region (Zhang et al., 2015).
By combining dasymetric mapping techniques (Mennis, 2003) with land cover data derived from satellite images, surface-based population data can be derived and overlaid with DEM to improve the vertical resolution of population spatial distribution (Briggs et al., 2007). Although some of the population has migrated to super cities or big cities in the process of urbanization, the overall spatial distribution pattern of China’s population calculated by county has not changed, indicating its horizontal stability (Zhou and Xiong, 2018). However, in the vertical dimension, there is no definite conclusion as to whether there is some alternation about the relationship between the population distribution pattern and altitude. With the development of dasymetric mapping techniques, case reports have been produced on the relationship between population distribution and topography based on high spatial resolution data at the local level; however, studies conducted at the national level have not yet been seen. Based on 1 km cell-size gridded data set of China’s population spatial distribution and DEM data with 1 km resolution, this study analyzes the dynamic changes in population distribution data by altitude at the national level from 1990 to 2015, and quantifies the dominant role of natural environmental factors in this pattern. It is very important to understand the ecological and socio-economic factors in population distribution and their changes over time for the compilation of regional development planning and the guidance of rational population flow.
-
The study area is 31 provinces except for Hong Kong, Macao and Taiwan in China. As we all know, China is populous and has a population about 1.384 × 10⁹ in 2015 (National Bureau of Statistics of China, 2016). China’s terrain is high in the West and low in the East, forming a three-step ladder. According to the landform, it can be divided into five basic types: mountain, plateau, hill, basin and plain. Due to its vast territory, China’s climate types are complex and diverse. According to different temperatures, from south to north, there are nine climate zones, including tropical, subtropical and temperate zones, and one plateau climate zone. The spatial distribution of China’s population is extremely unbalanced, which reflects the ability of human beings to adapt and transform nature (Zhang, 2003). In 1935, Hu Huanyong proposed the Hu Huanyong line (also called the Heihe-Tengchong line, Hu line), which divides China’s population distribution into two parts, southeastern and northwestern (Hu, 1935). The densely populated area to the east of the line is characterized by a humid climate, abundant water sources, open land, excellent ports, rich cultivated land resources, and developed industry and agriculture; the sparsely populated area to the west of the line is characterized by a cold and dry climate, little wind, sand and rain, dense plateau mountains, and extensive desert (Wang, 1998; Li et al., 2009; Lin et al., 2017). Since the reform and opening up, population migration has become a geographical process on a huge scale and of profound significance (Zhu and Lin, 2016). China’s population has the distinct characteristics of migration and flow from rural areas to cities and towns, and from inland areas in the central and western regions to coastal provinces in the east (Zhu and Lin, 2016).
-
The data used in this paper are China’s Population Spatial Distribution Gridded Datasets (CPSDD) over a 25-yr period (for the years 1990, 1995, 2000, 2005, 2010, and 2015), 1 km gridded DEM covering the whole of China and the terrain map, the climate map and the landform map of China. The CPSDD and 1 km DEM data were downloaded from the Resource and Environment Data Cloud Platform (
http://www.resdc.cn/DOI ). The terrain map, the climate map and the landform map of China are all in digital form and from Institute of Geographic Sciences and Natural Resources Research, Chinese Academy of Sciences.Based on the national population statistics for counties (National Bureau of Statistics of China, 1991–2016), and taking full account of land use type, night light brightness, residential density, and other factors closely related to the population, CPSDD was derived using the multi-factor weight distribution method (Xu, 2017). In order to make further study, the accuracy of the datasets was evaluated with demographic data, which were from CNKI (China National Knowledge Infrastructure). The evaluation of accuracy showed that CPSDD can be studied further.
-
Population density is the main form of population distribution and the main indicator of regional differences in population distribution (Zhu, 1991; Liu et al., 2003). In order to obtain the population and the altitude of a specific point, the DEM data were projected, and georeferenced with CPSDD, and then, the median of the elevation and the sum of the population within each 100 km2 quadrangle (the fishnet grid) were available.
Then, the table of the joint distribution of population and elevation was ordered by elevation. The integrated population density (IPD) function (Small and Cohen, 2004) accounts for land area by normalizing hypsographic demography trends (hereinafter ‘hypsographic profiles’). At intervals of 100 m, the population size (PS) and land area were calculated, and the IPD (the number of people divided by the land area) was calculated using Formula (1).
$$IPD = \dfrac{{\displaystyle\sum {{P_e}} }}{{\displaystyle\sum {{A_e}} }}$$ (1) where Pe and Ae stand for the sum of the population and the total land area in each 100 m elevation range. The population steps are divided according to the IPD calculated.
-
Geographical detector model is a new statistical method for detecting spatial heterogeneity and revealing the driving forces behind it (Wang et al., 2017). In order to explore the relationship between population density and topography, geomorphology, and climatic elements and their interactions, the geographical detector model is adopted. The q value was calculated by Formula (2):
$$q = 1 - \dfrac{{\displaystyle\sum\nolimits_{h = 1}^L {{N_h}{\sigma _h}^2} }}{{N{\sigma ^2}}}$$ (2) where N and
${\sigma ^2}$ stand for the number of units and the variance of Y in a study area, respectively; the population Y is composed of L strata (h = 1, 2, …, L). Nh and${\sigma _h}^2$ stand for the variance of strata h.The value range of q is used to indicate to what degree of factor X controls the spatial distribution of Y (Wang et al., 2016). The rule in Fig. 1 was used to judge the nonlinear enhanced interaction between independent variables X1 and X2 (Wang et al., 2017).

Figure 1. Discriminant rules for nonlinear enhancement interaction between independent variables X1 and X2
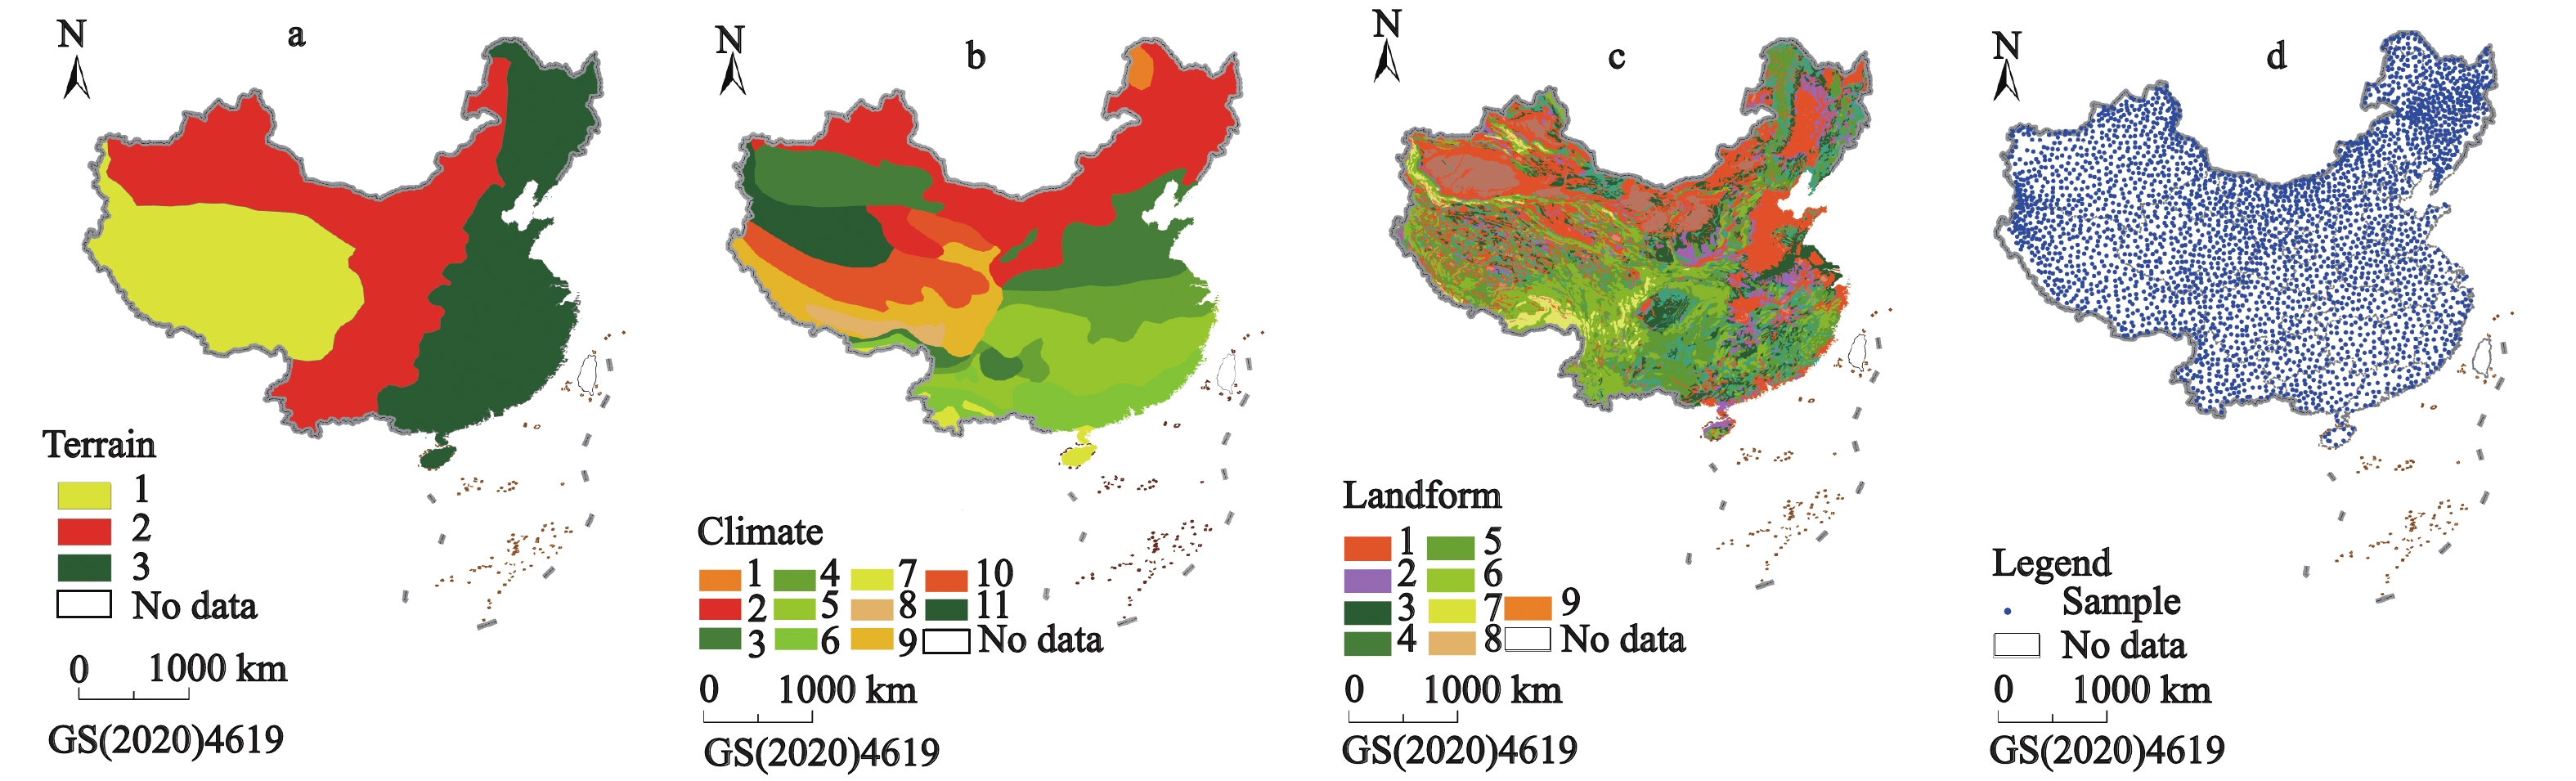
In order to quantify the impact of natural geographical factors such as topography, landform, and climate on the distribution pattern of population density, the average value of population density in 1990, 1995, 2000, 2005, 2010, and 2015 was taken as dependent variable y, and the classification variables were terrain (X1), landform (X2), and climate (X3). The classification and the distribution of topography, geomorphology, and climate are shown in Fig. 2.

Figure 2. Zoning of terrain (a. 1: step 1; 2: step 2; 3: step3), climate (b. 1:cold temperate zone; 2: middle temperate zone 3: warm temperate zone;4: north subtropics; 5: central subtropics; 6: south subtropics; 7: marginal tropics; 8: plateau temperate zone; 9: plateau sub temperate zone;10: plateau sub cold zone;11: plateau cold zone), and landform (c. 1: plain; 2: platform; 3: hill; 4: small rolling mountains; 5: medium rolling mountains; 6: big rolling mountains; 7: very big rolling mountains; 8: water; 9: other) and the distribution of samples (d) to make geographical detector. Hong Kong, Macao and Taiwan of China are not included in this paper
2.1. Study area
2.2. Data
2.3. Research methods
2.3.1. Calculating population size (PS) and integrated population density (IPD)

2.3.2. Geographical detector model


-
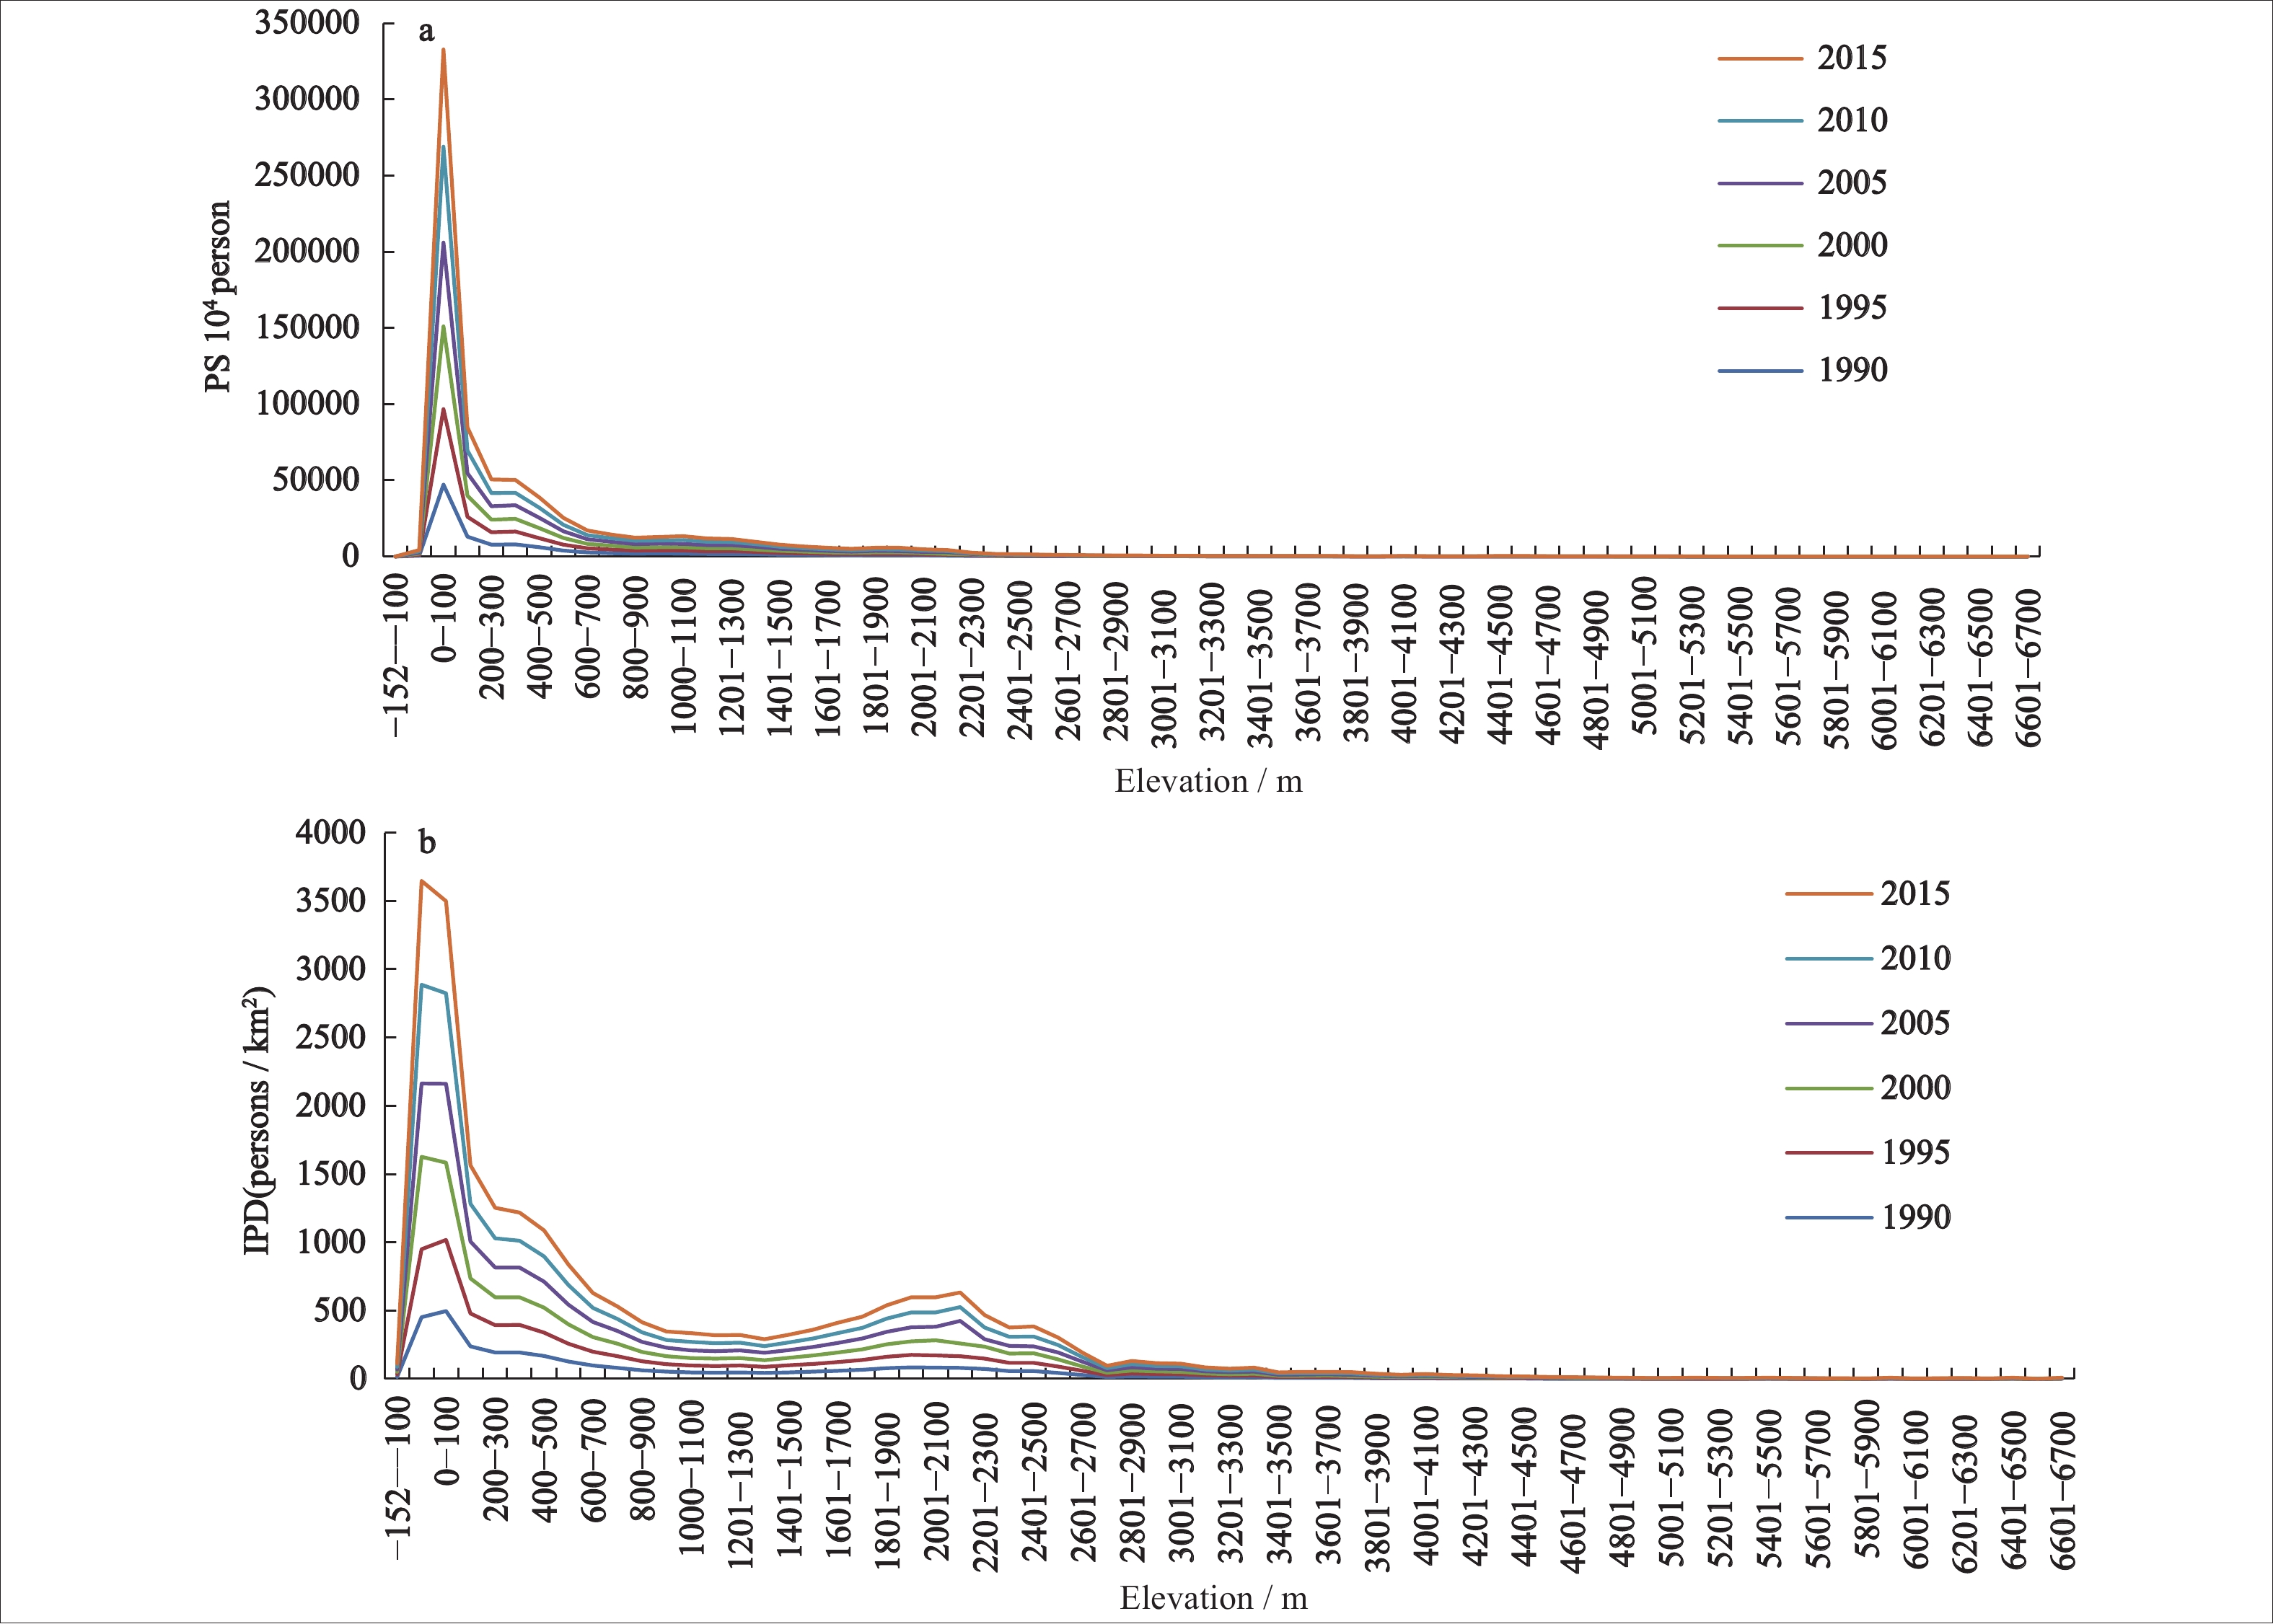
On the whole, both PS and IPD decrease sharply with elevation, showing a reverse-J distribution from 0 m above the sea level (Fig. 3), and this spatial pattern is basically stable. In 1990, the population varied between 4.7231× 10⁸ persons (at 0–100 m above sea level) and less than 15 persons (at 6600–6700 m above sea level). IPD decreased from 497.24 persons/km2 at 0–100 m to 0.06 persons/km2 at 6500–6600 m, which shows a very big population gap between low-altitude and high-altitude areas. In 2015, the population decreased varied from 6.3936 × 10⁸ persons at 0–100 m to less than 26 persons at 6600–6700 m, and the IPD was 758.43 persons/km2 (0–100 m), falling to 0.17 persons/km2 (6500–6600 m). It can be concluded that PS and IPD decreased sharply with elevation, and that the difference between low-altitude and high-altitude areas increased with time due to the increasing density in low-altitude areas.

Figure 3. Population size (PS) (a) and integrated population density (IPD) (b) according to elevation from 1990 to 2015 in China. Hong Kong, Macao and Taiwan of China are not included in this paper
-
The population distribution can be divided further into five steps in the vertical dimension according to IPD in each 100 m elevation range (Table 1). It can be seen that the difference of population density in different elevation ranges is obvious. Furthermore, the PS and the IPD in each population step in different year was calculated further (Table 2).
Number of the population step Elevation range / m IPD / (persons/km2) Step 1 –100–100 > 300 Step 2 100–600 100 ≤ IPD < 300 Step 3 600–2700 25 ≤ IPD < 100 Step 4 2700–3100 and –152– –100 15 ≤ IPD < 25 Step 5 > 3100 < 15 Note: Classification refers to Fig. 2; Hong Kong, Macao and Taiwan of China are not included in this paper Table 1. Elevation range and the integrated population density (IPD) in each population step of China
Number of the
population step1990 1995 2000 PS /
104Percentage /
%IPD /
(persons/km2)PS /
104Percentage /
%IPD /
(persons/km2)PS /
104Percentage /
%IPD /
(persons/km2)Step 1 47744.082 43.05 496.70 50122.358 43.52 521.44 55160.971 44.38 573.86 Step 2 38678.290 34.88 191.89 39449.142 34.26 195.72 41281.547 33.22 204.81 Step 3 23319.973 21.03 59.49 24391.561 21.18 62.22 26484.369 21.31 67.56 Step 4 395.020 0.36 16.58 413.692 0.36 17.37 459.842 0.37 19.31 Step 5 759.146 0.69 3.13 782.123 0.68 3.22 892.840 0.72 3.68 Country 110896.511 100.00 115.98 115158.876 100.00 120.44 124279.570 100.00 129.83 Number of the
population step2005 2010 2015 PS /
104Percentage /
%IPD /
(persons/km2)PS /
104Percentage /
%IPD /
(persons/km2)PS /
104Percentage /
%IPD /
(persons/km2)Step 1 55618.237 43.39 578.62 63667.192 47.34 662.36 64812.726 46.82 674.27 Step 2 43637.232 34.05 216.49 42482.027 31.59 210.76 44172.109 31.91 219.15 Step 3 27464.892 21.43 70.06 26894.731 20.00 68.61 27905.602 20.16 71.19 Step 4 464.380 0.36 19.50 457.693 0.34 19.22 481.441 0.35 20.21 Step 5 979.289 0.76 4.04 994.830 0.74 4.10 1071.263 0.77 4.42 Country 128164.031 100.00 129.98 134496.473 100.00 140.67 138443.141 100.00 144.80 Note: Hong Kong, Macao and Taiwan of China are not included in this paper Table 2. Population size (PS), percentage, and integrated population density (IPD) in each population step and in different year in China
The geographical location of the population steps is shown in Fig. 4 according to the elevation range. It can be seen clearly that the scope of the first and second steps basically account for the most of the east of Hu line (Hu, 1935), including the Northeast Plain, North China Plain, the middle and lower reaches of the Yangtze River Plain, the Junggar Basin, the Guanzhong Plain, the Sichuan Basin, and the Pearl River Delta. The first step has the largest population, which accounted for approximately 43.05% of the total population of China in 1990. This increased over the period, accounting for 46.82% of the country by 2015. The IPD, which was approximately 500 persons/km2 (Table 2) in 1990, also increased continuously, exceeding 674 persons/km2 in 2015. The total population of the second step accounted for 34.88% of the whole country in 1990, but the growth rate was slow, and its proportion of the whole country dropped to 31.91% in 2015. The IPD was approximately 200 persons/km2 in 1990, and increased slowly to 219.15 persons/km2.

Figure 4. Geographic distribution of the five population steps in China
The scope of the third population step is more consistent with that of the second terrain step, and includes the surrounding areas of the Tarim and Jungger Basins, the Hexi Corridor, the Loess Plateau, mountains and plateaus from the east of Hengduan Mountains to the Da Hinggan Mountains, and the Taihang, Funiu, and Xuefeng Mountains. The total population in this step accounted for 21.03% of the total population of China in 1990, and increased slowly over the period, accounting for 20.00% and 20.16% of the total population in 2010 and 2015, respectively; the IPD increased from 59.49 persons/km2 in 1990 to 71.19 persons/km2 in 2015. Growth in this step was relatively slow, and its proportion of the population of the country decreased slightly.
The fourth population step is located mainly to the north of the Qinghai-Tibet Plateau, with a small area and a small total population but a high relative growth rate. The total population accounted for 0.36% of the country in 1990 and 0.35% in 2015, while the IPD increased from 16.58 persons/km2 in 1990 to 20.21 persons/km2 in 2015.
The fifth population step is located mainly on the Qinghai Tibet Plateau. As the ‘third pole of the Earth’, the Plateau is a sparsely populated area (Cheng and Shen, 2000; Qi et al., 2020) with a unique and ecologically fragile natural environment (Qi et al., 2020). The IPD of this step is the smallest, although its proportion of the total population is greater than that of the fourth step, because of its large coverage area. In 1990, the IPD had a little more than 3 persons/km2, but in 2015 it exceeded 4 persons/km2.
-
Taking topography, climate, and geomorphic type as classification variables, the dominant factors in population density continuity were identified. The average population density values for each class are shown in Table 3. The q value and its magnitude for each explanatory variable are as follows: climate (0.149) > topography (0.138) > landform (0.036), which indicates that climate, topography, and geomorphic type play a dominant role in the distribution of population density, with climate playing the most important role, followed by topography and geomorphic type.
Terrain (X1) Climate (X2) Classification 1 2 3 1 2 3 4 5 6 7 8 9 10 11 Mean / (persons/km2) 5 95 354 6 59 337 388 322 307 144 7 9 3 2 Landform (X3) Classification 1 2 3 4 5 6 7 8 9 Mean / (persons/km2) 205 271 241 175 107 78 18 101 11 Table 3. Average population density in different classification of terrain, climate, and geomorphic factors in China
Tables 4 to 6 give the detection results for differences between the partitions of the variables. There are significant differences among different terrains; however, not all the differences in each type of climate and landform are significant, which indicates that the role of climate, geomorphology, and topographic factors in population distribution is very complex.
Factor 1 2 3 1 2 Y 3 Y Y Notes: Meanings of 1–3 see Fig. 2; Y means that a significant difference was detected Table 4. Statistical differences in population density among regions that differ in terrain
Factor 1 2 3 4 5 6 7 8 1 2 N 3 N N 4 N Y Y 5 Y Y Y Y 6 Y Y Y Y Y 7 Y Y Y Y Y Y 8 Y Y Y N N N Y 9 Y Y Y Y Y Y N Y Notes: Meanings of 1–9 see Fig. 2; Y means that a significant difference was detected; N means that no significant difference was detected Table 6. Statistical differences in population density among regions that differ in geomorphic type
Factor 1 2 3 4 5 6 7 8 9 10 1 2 Y 3 Y Y 4 Y Y N 5 Y Y N Y 6 Y Y N N N 7 Y Y Y Y Y Y 8 N Y Y Y Y Y Y 9 N Y Y Y Y Y Y N 10 Y Y Y Y Y Y Y Y Y 11 Y Y Y Y Y Y Y Y Y N Notes: Meanings of 1–11 see Fig. 2; Y means that a significant difference was detected; N means that no significant difference was detected Table 5. Statistical differences in population density among regions that differ in climate
Table 7 shows the results for the detection of interaction. Because q (terrain ∩ climate) > q (terrain) + q (climate), the interaction of terrain and climate has a nonlinear enhancement effect on the distribution of population density. Similarly, q (terrain ∩ landform) > q (terrain) + q (landform), which indicates that the joint action of the elevation and relief of topography has a nonlinear enhancement effect on the change of population density. Likewise, q (landform ∩ climate) > q (landform) + q (climate) indicates that the joint action of geomorphic relief and climate has a nonlinear enhancement effect on the distribution of population density.
Factor X1 (Terrain) X2 (Climate) X3 (Landform) X1 (Terrain) 0.138 X2 (Climate) 0.288 0.149 X3 (Landform) 0.174 0.255 0.035 Table 7. Interaction among topography, geomorphology, and climate factors
-
Although the population distribution pattern of the five steps is basically stable, the population growth rate of each step is clearly different. In the first step, the IPD is constantly increasing, the total population is increasing, and its proportion of the population of the country is rising. In the second, third, and fourth steps, population growth is slow, and its proportion of the population of the country is relatively low. In the fifth step, the population is small in absolute terms, but the relative growth rate is high. The driving forces of dynamic change in the population distribution pattern are social and economic factors.
Since the implementation of the policy of reform and opening up, the eastern coastal areas have taken the lead in development, and the level of productivity has developed greatly. Meanwhile, with the reform of the household registration policy in rural areas, a large number of people have migrated from the inland provinces of the midwest to the eastern coastal provinces (Zhu and Lin, 2016). In the fourth and fifth steps, ethnic minorities live in compact communities and the absolute population is small. With the development of the social economy and improvements in living standards in ethnic minority areas, the population of this area has seen relatively rapid growth (Table 8).
Province 1990 1995 2000 2005 2010 2015 Qinghai – – 13.10 9.49 8.63 8.55 Tibet – – 12.90 10.79 10.25 10.65 China 14.39 10.55 7.58 5.89 4.79 4.96 Table 8. Natural population growth rates of Qinghai Province, the Tibet Autonomous Region and China from 1990 to 2015 / ‰
3.1. Change trends and dynamics of PS and IPD with elevation
3.2. Distribution pattern and dynamics of population based on IPD
3.3. Influencing factors of population density distribution
3.4. Driving forces of the dynamic change in population distribution pattern
-
The Hu line divides China’s population distribution into two parts (southeast and northwest) and marks great differences in topography, climate, soil fertility, land productivity, and population density. Analysis of the population distribution of the entire country based on altitude can quantify the influence of terrain, climate, and geomorphic natural factors and their interaction on the population distribution at a macro level, providing a basis for deeper understanding of the potential impact mechanism of these factors on population distribution. The Qinghai-Tibet Plateau does not only have a unique climate; it also has a profound impact on China as a whole, making the country’s climate complex and diverse. East China is a relatively independent monsoon climate region, where the circulation force of the East Asian monsoon is relatively powerful, the winter and summer monsoon replacement is more obvious, and the continental climate characteristics are more prominent. In summer, due to the shielding effect of the Qinghai-Tibet Plateau, the southwest monsoon from the Indian Ocean rarely crosses the Qinghai-Tibet Plateau and seldom enters the northwest of China; this causes drought in Gansu and Xinjiang. The influence of climatic conditions on population distribution is manifested mainly indirectly, through its restriction on agricultural production. Of course, the relationship between climate and topography is very close, and their roles in the population distribution are nonlinear. The joint influence of topography and climate determines the spatial allocation of water and soil resources and light and heat resources. Landform also plays a specific role in population distribution alongside climate and terrain. Located in plain and basin terrain conditions, with good hydrothermal conditions, superior soil-forming conditions, and low geographic cost (Li et al., 2009), it is conducive to the development of agricultural production activities, with dense rural and urban layout, and is a highly populated area (Zhang, 2003; Li et al., 2009; Liu, 2010;).
The third population ladder includes not only the plateaus and mountains southeast of the Hu Huanyong line but also the basins and plateaus west of the Hu Huanyong line; it covers monsoon and non-monsoon areas, and humid, semi-arid, and arid areas. As these areas are either restricted by terrain conditions or affected by climate conditions and water resources, the population density is limited. In the arid and semi-arid areas of the Tarim and Junggar Basins, the Hexi Corridor, and east of the Hexi Corridor toward Da Hinggan Mountains, water resources are scarce, precipitation is rare, the climate is dry, and land desertification is a serious issue. On the Loess Plateau, soil erosion is a matter of concern. The Yunnan-Guizhou Plateau in the south of Sichuan Basin, which belongs to an area of karst mountain plain and lacks soil resources, has slow vegetation growth and a fragile ecosystem (Wang and Zhang, 1999; Li, 2006). The mountainous areas to the east of the Sichuan Basin are mainly small and medium undulating mountains, and water resources are seriously lacking (Chen et al., 2018). These factors limit population growth and are a cause of the region’s relative poverty (Zhou and Xiong, 2018).
The fourth and fifth population steps are mainly located on the Qinghai-Tibet Plateau, including the Tianshan Mountains. As discussed above, the Qinghai-Tibet Plateau is a unique and fragile ecological environment and very sparsely populated in both Chinese and global terms (Cheng, 2000; Qi, 2020).
-
The natural environment is relatively stable, and has a steady influence on the distribution of the population (Zhang, 2003). In contrast, social and economic factors are active, and they drive dynamic changes in population distribution. Since China’s reform and opening up, along with the processes of urbanization, industrialization, and the implementation of the registered residence reform policy, China’s coastal areas have gradually become its most populous and economically developed regions (Liu, 2010). Good market conditions, deep historical foundations, and the economic strategy of giving priority to the development of eastern China have accelerated the concentration of capital in these areas, and industrialization and urbanization have interacted to promote regional economic development (Wang, 1998; Li et al., 2009). The regional agglomeration of capital and investment behavior is correspondingly enhanced, which has increased employment opportunities and encouraged the migration southeastward of workers and technical talents (Li et al., 2009). As the population and economic activity continues to concentrate in coastal areas, the Pearl River Delta Megalopolis, the Yangtze River Delta Megalopolis, and the Beijing-Tianjin-Hebei Metropolis have emerged, forming an important growth pole for China’s social and economic development (You et al., 2017). Social and economic factors drive this large-scale cross-regional migration, which leads to redistribution of the population and dynamic change in its altitude distribution pattern.
-
The q value of the climate factor calculated by the geographical detector model for population distribution is higher than that of the terrain factor. However, climate factors have so far received insufficient attention, which may be the reason for the slightly larger error of the data set at the county level. If the macro background layers, such as topography and climate, are taken into account, an improved algorithm may increase the accuracy of surface-based population data on different spatial levels.
-
This study on the spatial distribution of the population by altitude provides rich insights, but two main limitations should be noted. First, to calculate the IPD the method divides the elevation into groups at intervals of 100 m, which allocates the Sanjiang Plain in Northeast China to the first population step. However, with its cold climate and relatively late development, the Sanjiang Plain has a small population and low population density, which makes it quite different from the other regions in the first step. The second limitation is that the study does not take into account the influence of road traffic factors on the population distribution. However, as Wang (1997) pointed out, the main factors affecting and determining population distribution are natural environmental conditions and the level of infrastructure development. Liu (2003) also noted out that transportation is conducive to the development of cities, and that cities directly and significantly affect the spatial distribution of the population by means of population aggregation.
4.1. Population distribution pattern by elevation as a supplement
4.2. Dynamic change in the population distribution pattern as an indicator of the driving forces of the social economy
4.3. Importance of the role of climate factors in population spatialization
4.4. Limitations of hypsographic demography
-
From the findings above, four main conclusions can be drawn.
(1) In the vertical dimension, the total population below 3100 m above sea level accounts for 99% of the total population, and the population quantity and density decrease sharply with altitude below 1000 m, and the distribution pattern of the population according to altitude is basically stable.
(2) According to the comprehensive population density, the population distribution can be divided into five steps, in proportions of 43∶35∶21∶1∶0 and this pattern has remained relatively stable from 1990 to 2015.
(3) The basic pattern of the spatial distribution of the population is determined by topography, climate, geomorphology, and their interaction in the physical and geographical environment.
(4) Social and economic factors are the main driving forces of the dynamic changes in the population distribution pattern over the period. The distribution pattern and dynamics of population altitude in China are a comprehensive reflection of various geographical elements on different spatial scales.

 DownLoad: