HTML
-
The upland as a major source of land use takes up over 70% of the total croplands in China (Wang et al., 2011). Due to its vast area and relatively low soil organic carbon (SOC) levels, Chinese uplands have a large potential in terms of sequestrating more carbon in soils to enhance soil fertility and mitigating CO2 emissions via recommended management practices (Lal 2002; Xie et al., 2021, Zhang et al., 2017). Consequently, the precise quantification of the spatio-temporal changes in Chinese upland SOC has become vital for decision-making to maintain sustainable soil fertility management and mitigate climate change.
Concerning the significance of SOC for food production, soil and water quality enhancement, and greenhouse gas emissions mitigation (Qin et al., 2016; Wang et al., 2017; Zhao et al., 2018), many previous studies have examined the size and change in SOC of Chinese uplands through the meta-analysis of SOC data collected from published literature (Xie et al., 2007; Pan et al., 2010; Sun et al., 2010). However, the meta-analysis method has some inherent limitations, especially in representing the long-term time series of SOC dynamics and the impacts of heterogeneous soil conditions and management practices on SOC dynamics (Sun et al., 2010; Yu et al., 2012). Hence, process-based models, such as CENTURY, DNDC and RothC model (Jenkinson and Rayner 1977, Parton et al., 1987; Li et al., 1992) are often adopted for SOC simulation at a larger scale or area extent for a comprehensive and quantitative understanding of SOC spatio-temporal dynamics.
Process-based models have been recognized as a powerful tool in SOC dynamics estimates at various scales (Necpalova et al., 2015). Process-based models, such as CENTURY, RothC and DNDC, were developed on the strength of the mathematic relationships of soil organic matter (SOM) turnover mechanisms, and have been successfully applied in cropland SOC dynamics modelling worldwide (Yu et al., 2017). Nevertheless, considerable uncertainties caused by lacking spatially explicit model input data may be brought into the extrapolations of the process model which predicts SOC at regional-or national-scale. Consequently, quantitative uncertainty information originated from the heterogeneous input data of the model is indispensable to increase the credibility of SOC estimation at large-scales (Fitton et al., 2014). To be specific, the CENTURY model has been widely employed in regional-and national-scale estimates of SOC dynamics in upland soils (Ardö and Olsson 2003; Tornquist et al., 2009; Lugato et al., 2014). However, there are still limitations caused by quantitative uncertainty information on CENTURY-modelled SOC dynamics, especially the uncertainties resulting from the uncertain heterogeneous input data of the model, even though such quantitative uncertainty information is particularly crucial when the simulation results are used in decision-making and management practice recommendation development. After quantifying the uncertainties of CENTURY-modelled SOC for US croplands between 1990 and 2000, Ogle et al. (2010) found that the uncertainties of the estimated SOC sequestration rates (represented as 95% confidential interval) were 11.5–17.8 Tg C/yr for the period of 1990–1995, and 14.7–20.4 Tg C/yr for the period of 1995–2000, respectively. The uncertainties of the estimated changes in SOC in the uplands of northeastern China by Liu et al. (2019) were –207 to –9 Tg C and –76 to 56 Tg C during the periods of 1980–2010 and 2010–2050, respectively. Thus, based on the estimated uncertainty intervals, it was safe to conclude that in uplands of northeastern China, SOC loss over the period of 1980–2010 was certain while SOC increase/decline in the next four decades remained uncertain. The method adopted by Liu et al. (2019) can be adjusted to use in the nationwide SOC estimation to obtain more reliable modelling SOC and contribute to national decision-making and policy development on soil fertility improvement and carbon management.
Uplands are predominant cropland types for supporting staple food production in China. Detailed information on the spatio-temporal changes in SOC plays a significantly positive role in improving soil fertility and mitigating carbon loss of Chinese upland soils. However, the knowledge of the spatio-temporal changes in SOC and the corresponding uncertainties of SOC in Chinese upland soils remains limited at the national scale. As a result, this study aims to: 1) estimate the spatio-temporal changes in SOC of Chinese uplands during the period of 1980–2010 using the CENTURY model; 2) characterize the regional differences of SOC changes and explore the influences of soil types on changes in SOC; and 3) get insights into the uncertainties of SOC simulation, especially the uncertainties caused by a lack of spatially explicit model input data.
-
Upland soils in China can be categorized into 50 major soil types covering an area of approximately 1.0 × 10⁸ ha (Zhao et al., 2004). To investigate the spatial variety of SOC in uplands of China, they were classified into six regions, including the northeastern, northern, northwestern, eastern, south central and southwestern regions according to the environmental and farming conditions, as well as administrative areas in this study. Upland soils are mainly distributed in northeastern, northern, eastern, and south central China. Predominant upland soils are Meadow soils and Black soils in northeastern China, Fluvo-aquic soils in northern, eastern and south central China, Purplish soils in south central and southwestern China, and Cultivated loessial soils and Cinnamon soils in northwestern China (Fig. 1).

Figure 1. Upland soils. a) Distribution in China (Taiwan, Hong Kong and Macao were excluded); and b) Area percentages of Top 10 soil types. Northeastern China includes Heilongjiang (HLJ), Jilin (JL) and Liaoning (LN); northern China includes Beijing (BJ), Hebei (HeB), Shanxi (SX), Inner Mongolia (IM) and Tianjin (TJ); northwestern China covers Gansu (GS), Shaanxi (SaX), Ningxia (NX), Qinghai (QH) and Xinjiang (XJ); eastern China includes Shanghai (SH), Jiangsu (JS), Zhejiang (ZJ), Anhui (AH), Fujian (FJ), Jiangxi (JX) and Shandong (SD); south central China includes Henan (HeN), Hubei (HuB), Hunan (HuN), Guangdong (GD), Guangxi (GX) and Hainan (HaN); southwestern China includes Chongqing (CQ), Sichuan (SC), Guizhou (GZ), Yunnan (YN) and Tibet (T); TW: Taiwan; HK: Hong Kong; MC: Macao. FS: Fluvo-aquic soils; CS: Cinnamon soils; MS: Meadow soils; PuS: Purplish soils; ClS: Cultivated loessial soils; BrE: Brown earths; LCS: Lime concretion black soils; BS: Black soils; C: Chernozems; CA: Castanozems; OS: Other soils
-
The CENTURY model (v. 4.6) is a computer plant-soil ecosystem model developed by Natural Resources Ecology Lab of Colorado State University. Its suitability in modelling SOC dynamics at plot and regional scale for Chinese upland soils has been examined in our earlier research (Liu et al., 2017, Liu et al., 2019). In the previous studies, it was found that the linear relationship between the estimated and observed SOCs was significant (R2 = 0.97, P < 0.001) in China (across 21 long-term monitoring sites with different climates, soils and management conditions) (Liu et al., 2017). Moreover, the regional scale validation of CENTURY in the northeastern China also implied that the modelled SOC was reliable at county level as most of the estimated intervals overlapped with observed intervals and the mean observed SOC was significantly correlated with the simulated SOC (r = 0.96, P < 0.01) (Liu et al., 2019).
-
The input data used to drive the CENTURY model are mainly classified into three types: 1) soil properties, including the initial SOC level, soil texture, bulk density and pH; 2) climate data, covering the monthly precipitation, maximum and minimum temperatures; 3) management practices, such as tillage, irrigation, manure and nitrogen fertilizer additions, residue removal ratio and crop rotation (Parton et al., 1987). Some key input data of soil properties (the initial SOC content, clay content, bulk density, pH) and management practices (residue removal ratio, nitrogen fertilizer and manure additions) that exhibit great heterogeneity were chosen and compiled to drive the CENTURY model to quantify the SOC dynamics and the uncertainty correlated with the model input data. The uncertain input data denoted by the probability distribution functions (PDFs) were organized by the observations of these data.
Soil properties in the topsoil (to 20 cm depth) were derived from 3062 measurements of the Second National Soil Survey of China (implemented from the late 1970s to the early 1980s). The normal probability distribution (each soil type in each province) was employed to represent the prior uncertainties of soil properties except in 150 modelling units (soil type in a province), where merely one measurement is available.
The spatial distributions of SOC were represented by 1600 soil polygons (modelling units) through the spatial overlay of the 1∶1 000 000 soil map (group level), the 1∶1 000 000 land use map, and administrative boundary polygons with the application of ArcGIS 9.3 software. Subsequently, the initial fractions of SOC compartments for each soil type within each province (sum up to 353 polygons) were estimated using the Three-step initialization method (Ogle et al., 2010; Wang et al., 2011, Liu et al., 2019).
The residue removal ratio of each province was set in a uniform PDF in line with the field investigation on straw amendments implemented in 2011, covering 60 most representative counties across 31 provinces of China. Detailed information about the nitrogen fertilizer and manure additions, together with the other inputs, such as meteorological data, crop rotations, and crop production parameters, were set based on our previous research (Liu et al., 2019). According to the availability of model input data, the modelling duration was set from 1980 to 2010.
-
The Monte Carlo method was employed to quantify the uncertainties of CENTURY-modelled SOC dynamics which are relevant to the spatial heterogeneity of input data. The CENTURY model was repeatedly driven by the random input data sampled from the PDFs constructed in the ‘Model input data’ section. In the process of the uncertainty analysis, the CENTURY model was executed repetitively 4500 times for each modelling unit, leading to a total of 6 525 150 (1450 × 4500 + 150) times of CENTURY model runs. The uncertainty was represented by the 95% confidence intervals of the SOC estimates. In the meantime, the percentage uncertainty of the estimated SOC was figured out by 95% confidence interval/ (2 × mean) (Ogle et al., 2010; Yu et al., 2012). R 3.1.1 software and data I/O codes of C# were used to implement the Monte Carlo analysis.
2.1. Study area
2.2. CENTURY model and validation for Chinese upland soils
2.3. Model input data
2.4. Uncertainty analysis
-
Overall, the CENTURY-modelled SOC storage and the associated uncertainty changed over time (Fig. 2a). During the past three decades, the SOC storage in topsoils (up to a depth of 20 cm) of Chinese uplands had increased from 3.03 Pg C to 3.40 Pg C. The uncertainty intervals were from 1.59 to 4.78 Pg C in 1980 and from 2.39 to 4.62 Pg C in 2010. The SOC storage increment during this period was 370 Tg C with the uncertainty interval ranging from –440 to 1110 Tg C. The mean percentage uncertainty of SOC storage estimated according to method in 2.4 was 41%, which decreased from 52% in 1980 to 33% in 2010. The rates of SOC change underwent three distinct stages. To be specific, SOC storage declined whilst the decrease rate of SOC gradually reached to 0 in the late 1980s, and then, the increase rate of SOC persistently increased in the 1990s, finally reaching to a relatively stable level in the 2000s (Fig. 2b). Mean changing rates of SOC in the 1980s, 1990s and 2000s were –5, 18 and 24 Tg C/yr, respectively, with mean 95% confidence intervals ranging from –40 to 24, –6 to 41 and 2 to 45 Tg C/yr, respectively.

Figure 2. CENTURY-modelled soil organic carbon (SOC) dynamics for Chinese upland soils. a) SOC storage, b) changes in SOC storage
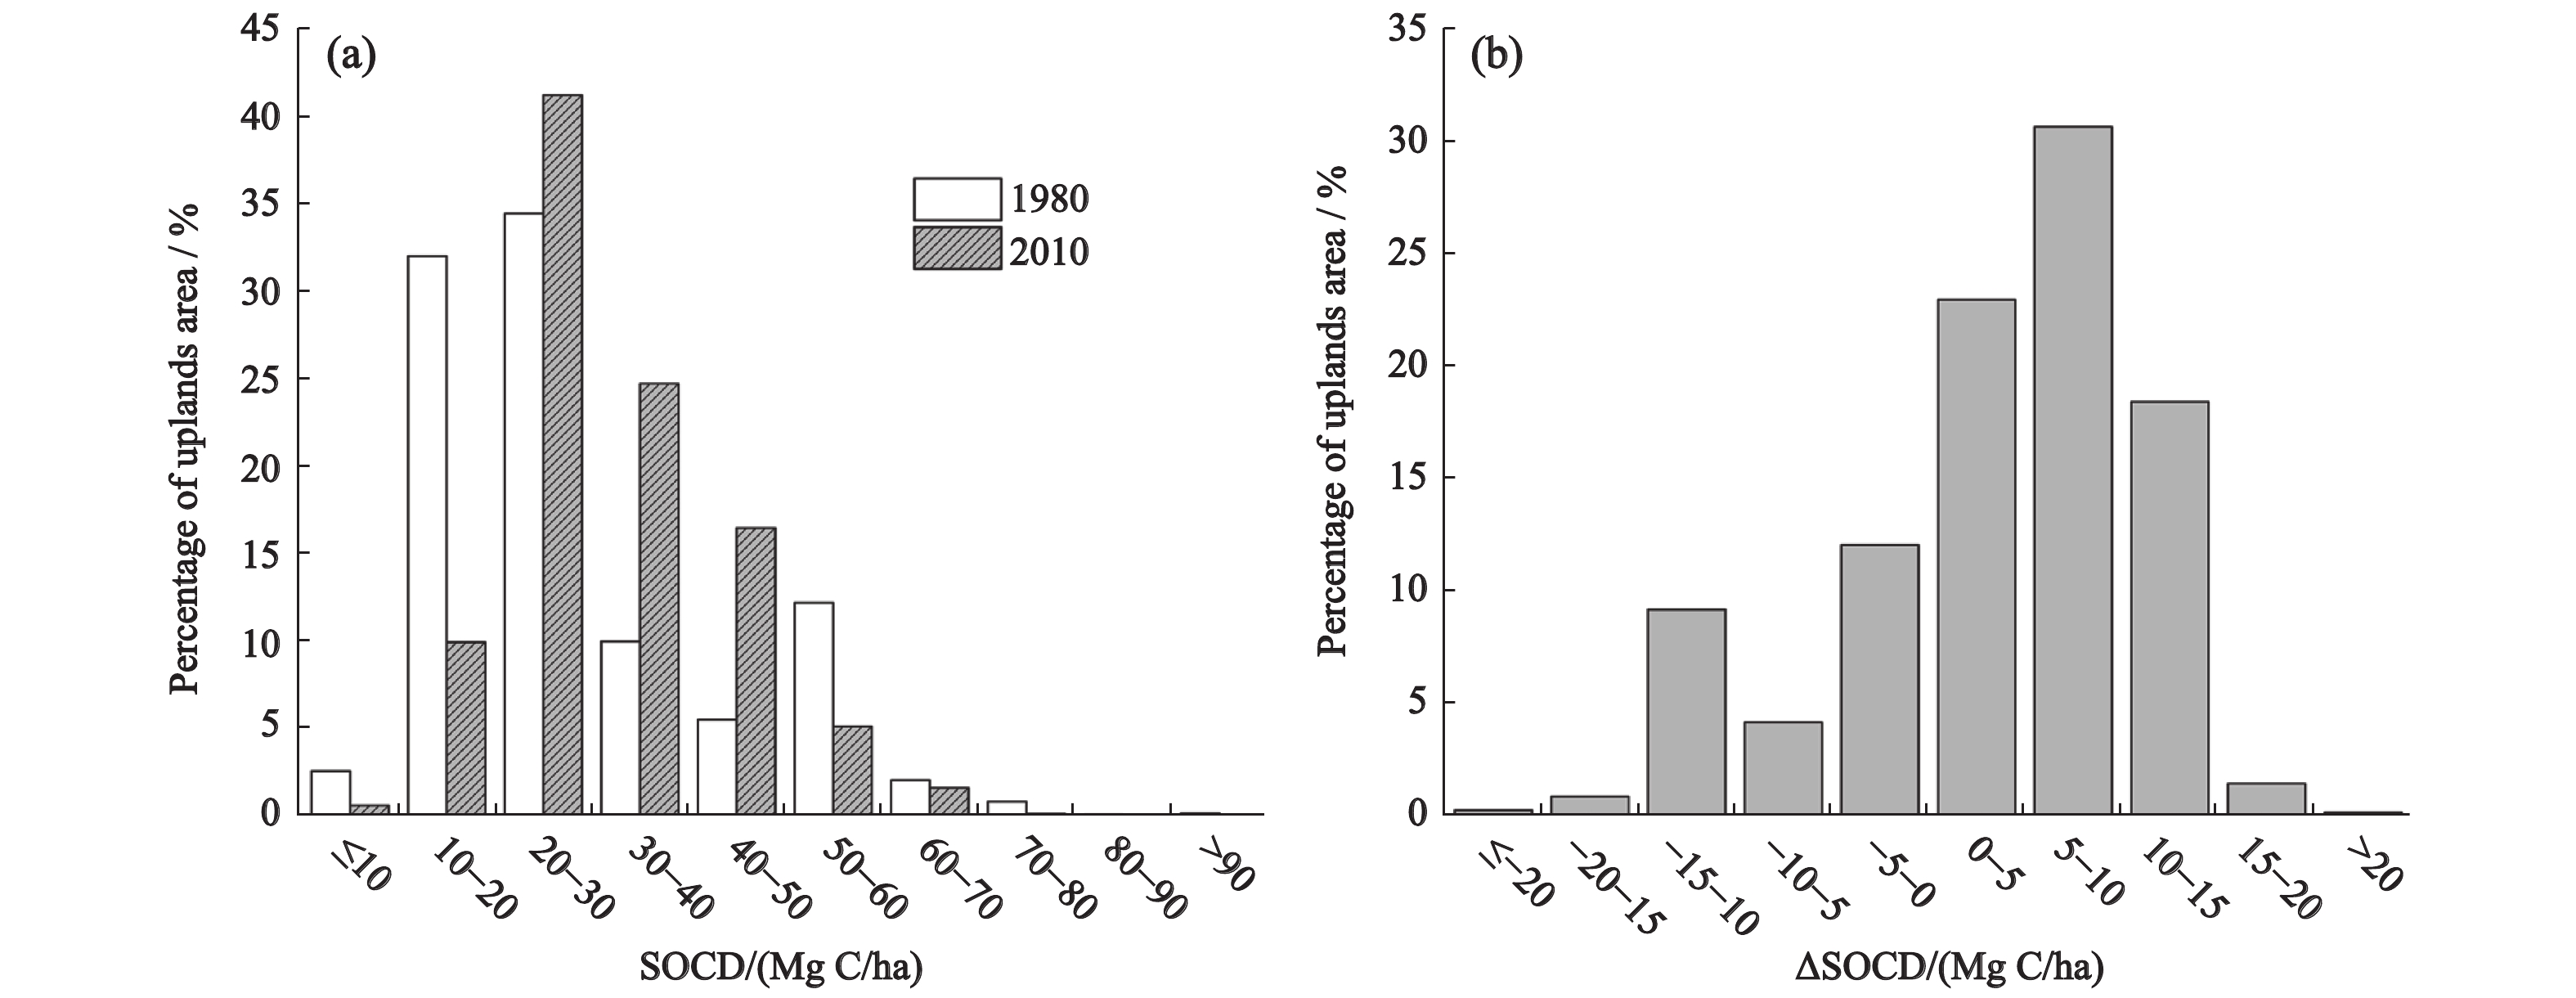
The estimated mean SOC storage for Chinese uplands (upper 20 cm) over the past three decades was 3.11 Pg C, representing an average soil organic carbon density (SOCD) of 29.4 Mg C/ha. The median value of the simulated SOCD as a robust estimator was utilized to figure out the area proportions of different SOCD levels in Chinese uplands (Fig. 3). The area percentage for SOCD being lower than 20 Mg C/ha decreased from 35% in 1980 to 11% to 2010, whilst for SOCD between 20 and 50 Mg C/ha, this figure increased from 50% in 1980 to 82% in 2010 (Fig. 3a). Overall, SOCD for approximately 74% of the Chinese uplands increased during the period of 1980–2010, and 31% of the uplands had a SOCD increment of 5–10 Mg C/ha (Fig. 3b). Additionally, the mean simulated SOCD of 1600 modelling units also increased by 4 Mg C/ha from 1980 to 2010, implying that Chinese upland soils served as a crucial carbon sink during this period.

Figure 3. Changes in soil organic carbon density (SOCD) from 1980 to 2010. (a) Distribution of SOCD in 1980 and 2010. (b) Distribution of changes in SOCD (ΔSOCD) from 1980 to 2010. ΔSOCD = SOCD2010 – SOCD1980. Uplands: upper 20 cm
-
The spatial distribution maps of the mean rate of changes in SOCD between 1980 and 2010 were shown in Fig. 4. A dramatic SOCD increase in Huang-Huai-Hai Plain of China (including Beijing, Tianjin municipalities, Shandong, Hebei, Henan, Jiangsu and Anhui provinces) can be obviously observed, while the SOCD decrease was mainly witnessed in Heilongjiang Province of the northeastern China (Fig. 4). Upland soils in the northern, eastern, and south central China had sequestrated 118, 132 and 97 Tg C over the past three decades, respectively, whereas upland soil in the northeastern China lost 113 Tg C during that period. SOC accumulation in Hebei, Shandong, Henan, and Sichuan provinces was most significant (Fig. 5). On contrast, SOC in upland soils of Heilongjiang, Inner Mongolia, and Guizhou declined by 136, 21 and 1 Tg C, respectively.

Figure 4. Spatial distribution of the mean rate of changes in SOCD (ΔSOCD) of China (Taiwan, Hong Kong and Macao were not covered as a result of the lack of data) between 1980 and 2010. Full names for provinces refer to caption of Fig. 1

Figure 5. Soil organic carbon (SOC) storages and their changes in the provinces of China (Taiwan, Hong Kong and Macao were not covered as a result of the lack of data) from 1980 to 2010. Full names for provinces refer to caption of Fig. 1
The regional discrepancies in SOC storages for different time periods were also considerable (Fig. 6). During the 1980s, the possibility of SOC loss in the northern, northeastern, and northwestern China was high, while SOC accumulation mainly occurred in the eastern, south central, and southwestern China. During the 1990s, only the northeastern China was highly likely to suffer from SOC lost, while SOC in the northern, northwestern, and south central China tended to rise. The SOC storages in the eastern and southwestern China rose by 57 and 40 Tg C, with the uncertainty intervals ranging from 23 to 85 Tg C, and 6 to 72 Tg C, respectively. The SOC in the northeastern China kept declining during the 2000s, whereas SOC storages in the other five regions showed a rising trend. Over the entire 30 years, the amounts of SOC accumulation were ranked as: eastern China (132, from 26 to 220 Tg C) > northern China (118, from –75 to 284 Tg C) > south central China (97, from –38 to 209) > southwestern China (82, from –25 to 187 Tg C) > northwestern China (54, from –44 to 141 Tg C) > northeastern China (–113, from –237 to 12 Tg C). The uplands in eastern China functioned as a crucial carbon sink, and accounted for 35% of the total SOC increment in China, while SOC lost in the northeastern China represented –29% of the total change in SOC of China (Table 1). When uncertainties associated with the estimated SOC changes were taken into account, however, only the eastern China could be confirmed to function as a carbon sink over the 30 years. The changing trend of SOC in upland soils of the other five regions remained to be determined.

Figure 6. Soil organic carbon (SOC) changes and uncertainties among regions in the 1980s, 1990s, 2000s and three decades from 1980 to 2010. Bars denote 95% confidence intervals
Region Area / Mha SOC storage in 1980 / Pg C SOC storage in 2010 / Pg C ΔSOC percentage of total / % 1980s 1990s 2000s 1980–2010 NE 22.67 1.00 (0.62 to 1.40) 0.89 (0.62 to 1.18) 155.78 –12.77 –6.09 –28.68 N 23.45 0.59 (0.27 to 1.01) 0.71 (0.47 to 1.01) 23.88 28.25 31.70 30.92 NW 15.93 0.36 (0.20 to 0.56) 0.41 (0.30 to 0.55) 22.95 11.12 18.65 14.44 E 17.54 0.32 (0.15 to 0.55) 0.45 (0.34 to 0.60) –64.11 30.47 19.58 34.86 SC 13.73 0.34 (0.14 to 0.60) 0.44 (0.31 to 0.60) –27.86 21.66 19.44 26.22 SW 12.45 0.42 (0.21 to 0.66) 0.50 (0.35 to 0.68) –10.64 21.27 16.72 22.24 China 105.77 3.03 (1.59 to 4.78) 3.40 (2.39 to 4.62) 100.00 100.00 100.00 100.00 Notes: ‘–’ means that the SOC change in the region is opposite to the total SOC change in China. NE represents northeastern China, N represents northern China, NW represents northwestern China, E represents eastern China, SC represents south central China, and SW represents southwestern China. Numbers in the parentheses are 95% confidence intervals of the modelled SOC storages Table 1. Soil organic carbon (SOC) storages and SOC change (ΔSOC) percentage of the total in six regions
-
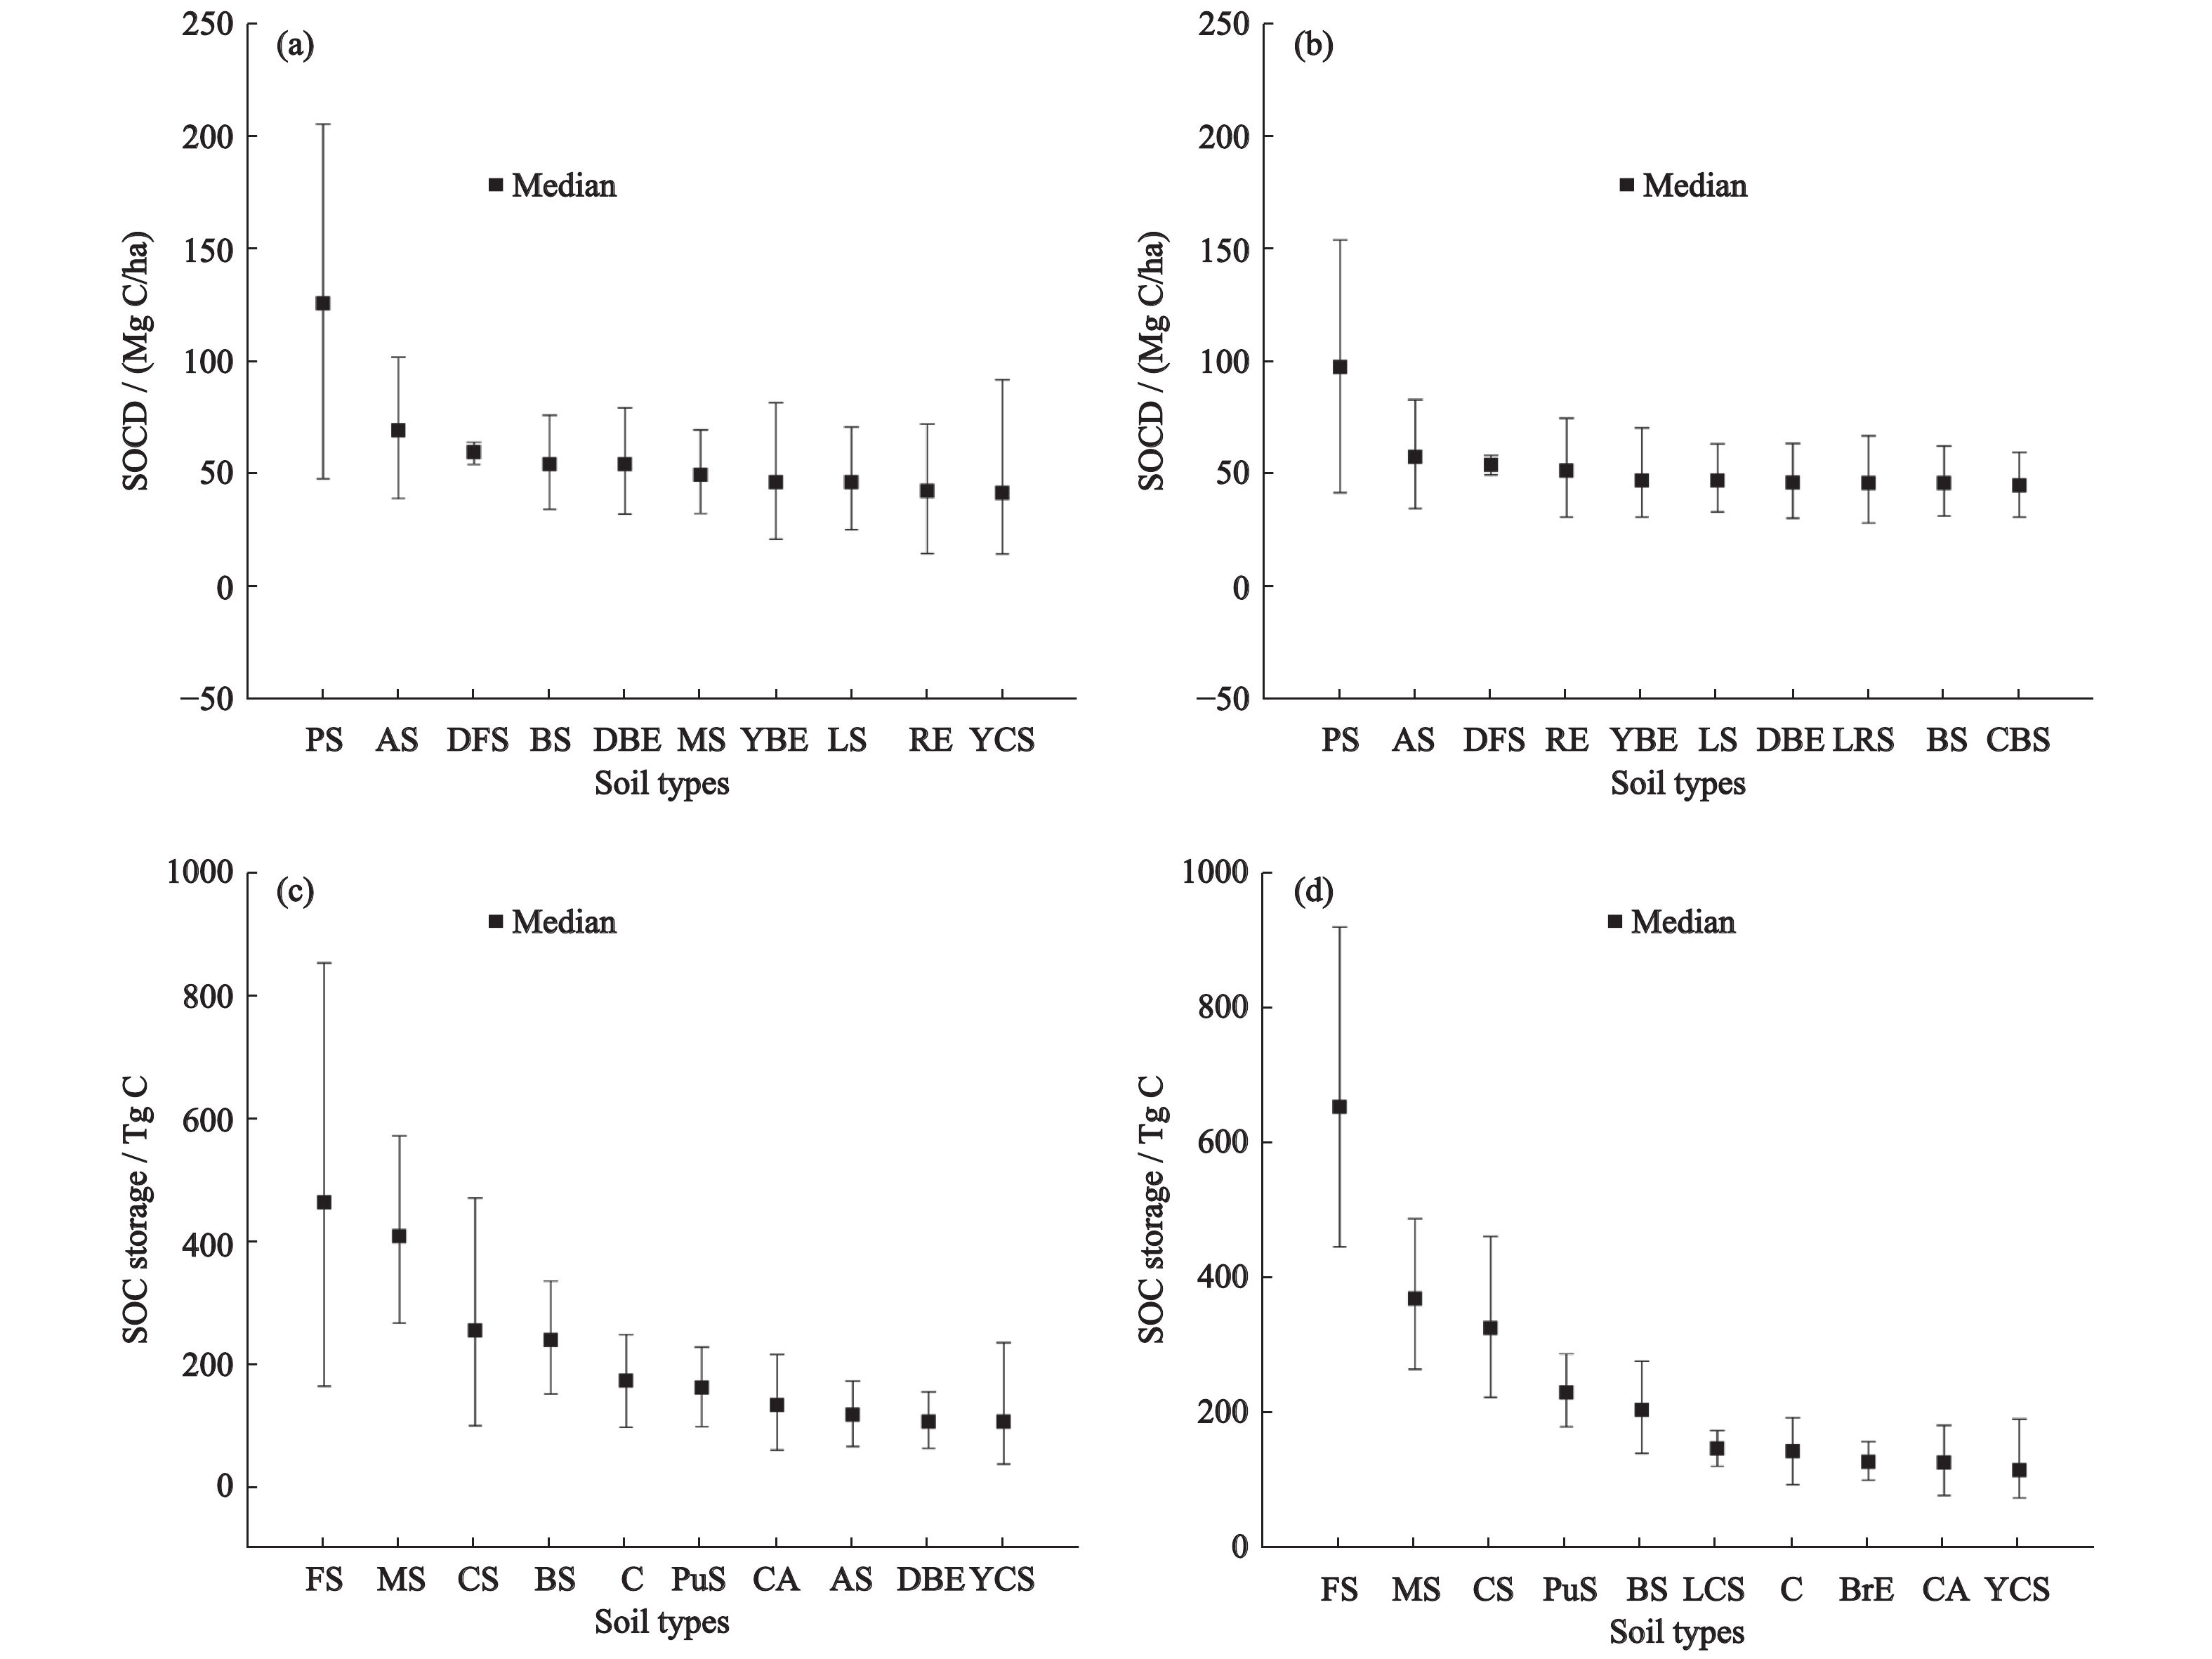
In 1980, the area-weighted means of SOCD (0–20 cm) for 50 major soil types of Chinese uplands varied from 10.4 Mg C/ha (Aeolian soils) to 125.8 Mg C/ha (Peat soils). SOC storages in 1980 for the 50 soil types ranged from 463 Tg C (Fluvo-aquic soils) to 0.015 Tg C (Red earths). Nevertheless, by 2010, the area-weighted mean of SOCD for the 50 soil types ranged from 13.6 Mg C/ha (Aeolian soils) to 97.2 Mg C/ha (Peat soils). The SOC storages for the 50 soil types ranged from 652 Tg C (Fluvo-aquic soils) to 0.027Tg C (Red earths). The soil types with top 10 highest SOCDs and SOC storages were manifested in Figs. 7a–7d. The total SOC storages for the top 10 soil types in 1980 and 2010 were 2.17 and 2.43 Pg C, respectively, both taking up 71% of the total SOC storage in topsoils of Chinese uplands.

Figure 7. Soil organic carbon density (SOCD) in 1980 (a) and 2010 (b), SOC storage in 1980 (c) and 2010 (d) of top 10 soil types. PS: Peat soils; AS: Albic soils; DFS: Dark felty soils; BS: Black soils; DBE: Dark-brown earths; MS: Meadow soils; YBE: Yellow-brown earths; LS: Limestone soils; RE: Red earths; YCS: Yellow-cinnamon soils; LRE: Lateritic red earths; CBS: Cold brown calcic soils; FS: Fluvo-aquic soils; CS: Cinnamon soils; C: Chernozems; PuS: Purplish soils; CA: Castanozems; LCS: Lime concretion black soils; BrE: Brown earths. Bars denote 95% confidence intervals
Over the past three decades, changes in SOC differed dramatically among soil types (Fig. 8). To be specific, SOCD for Peat soils, Albic soils, and Black soils declined most evidently (decreased by 28.5, 12.1 and 8.3 Mg C/ha, respectively), while SOCD for Red earths, Lime concretion black soils and Purplish soils increased most significantly (increased by 11.3, 11.0 and 10.0 Mg C/ha, respectively). SOC lost from Meadow soils, Black soils and Chernozems during these 30 years was most severe (decreased by 40.5, 36.6 and 31.5 Tg C, respectively), while SOC accumulation in Fluvo-aquic soils, Cinnamon soils and Purplish soils was most considerable (increased by 188.4, 69.6 and 66.6 Tg C, respectively).

Figure 8. Decline and increase in soil organic carbon density (SOCD) (a) and soil organic carbon (SOC) storage (b) from 1980 to 2010 in the top three types of soil. Full names for soil types refer to caption of Fig. 7
3.1. SOC dynamics over the past three decades
3.2. Regional differences in SOC stocks and their changes
3.3. SOC changes in different soil types
-
Although many researches have explored the rate of the SOC change in croplands of China, most of them were implemented within the local or regional range (Zhao et al., 2018). The nationwide estimate of upland SOC changes is still rare. Some of the existing national-scale estimates were based on the meta-analysis of literature data (Xie et al., 2007; Pan et al., 2010; Sun et al., 2010). However, other researchers (Wang et al., 2011; Yu et al., 2013) used process-based models (Table 2). There are differences between the results of the previous and current studies due to the considerable uncertainties originating from the limited sample size, multiple data sources, inconsistent analysis methods, and the inherent spatial heterogeneities of model inputs (Tang et al., 2018). Estimates derived from a meta-analysis of literature data would inevitably bring about a high level of uncertainty due to the spatial coverage limits of the literature data in the study area and the assumed changes in the SOC density, but quantifying such uncertainty is still hard (Sun et al., 2010). While for SOC estimates using the process-based model, uncertainties associated with the spatial heterogeneity of available model input data were usually overlooked (Liu et al., 2019). Nonetheless, this study provided not only the estimates of SOC but also their uncertainty intervals. Given the uncertainties resulting from the spatial heterogeneity of available model input data, our CENTURY model estimated the rate of SOC change for Chinese uplands during 1980–2010 was 12.3 Tg C/yr, with an uncertainty interval of –14.6 to 37.0 Tg C/yr. Even if the medians of SOC estimates were comparable to those of existing studies (Table 2), the ranges of estimated uncertainty intervals were still large owing to the availabilities of detailed model input data and inherent spatial heterogeneity of available input data for the model.
Period Area / Mha Soil depth/cm Change rate in SOC storage / (Tg C/yr) SOC storage / Pg C SOCD in 2010 / (Mg C/ha) Method Reference 1980–2000 125.9 19.4 18.5 3.07 – Meta-analysis Xie et al. (2007) 1985–2006 106.4 20.0 17.5 – – Meta-analysis Pan et al. (2010) 1980–2000 100.2 –20.0 10.7 (8.9 to 12.5) – – Meta-analysis Sun et al. (2010) 1980–2020 105.8 20.0 12.4 – – CENTURY model Wang et al. (2011) 1980–2010 87.3 30.0 – – 35.4 Agro-C model Yu et al. (2013) 1980–2010 105.8 20.0 12.3 (–14.6 to 37.0) 3.11 (2.1 to 4.5) 32.1 (22.0 to 42.6) CENTURY model The current study Notes: ‘–’ means no data. Numbers in the parentheses are 95% confidence intervals of the modelled SOC stocks Table 2. Estimated soil organic carbon (SOC) stock in uplands of China reported by different studies
-
The estimated uncertainty intervals for SOC storage change during the 1980s, 1990s, and 2000s were –40 to 24, –6 to 41, and 2 to 45 Tg C/yr, respectively. In this way, it was concluded that whether Chinese upland soils functioned as a carbon source or sink during the first two decades (1980–2000) remained uncertain, but it was definite that they acted as a carbon sink during the subsequent 10 years. Although SOC storage over the past three decades increased by 370 Tg C, the uncertainties associated with the spatial heterogeneity of model inputs remained high (from –440 to 1110 Tg C). Such uncertainties may exert a profound impact on decision–making and policy development. Thus, identifying the sources of uncertainties and developing strategies for reducing such uncertainties are vital in future modelling.
The initial SOC and clay content have been identified as the two most influential soil properties affecting the CENTURY-modelled SOC dynamics in Chinese uplands and such influences on CENTURY-modelled SOC were time-varying (Liu et al., 2017; 2019), which may explain why the uncertainties associated with the estimated SOC storage changed over time (Fig. 2a). Consequently, collecting more detailed information on the soil properties, especially initial SOC and clay content from legacy soil investigation data, is of great significance to provide credible and meaningful estimates of SOC for decision-making regarding soil fertility and carbon management. Besides, the estimated changes in SOC in northeastern China are slightly different from those in Liu et al. (2019) (–106 Tg C, with an uncertainty interval ranging from –207 to –9). This difference is mainly attributed to the data aggregation effect of the modelling units. Liu et al. (2019) divided uplands of northeastern China into 1037 modeling units by spatially overlaying soil subgroup boundary polygons with the county-level land-use boundary polygons. Furthermore, in this national-scale study, this region was categorized into 199 modelling units by spatially overlaying soil type boundary polygons with the city-level land-use boundary polygons. Despite this, estimated trends of SOC changes in uplands of northeastern China were consistent, indicating that the upland SOC lost in Northeastern China was definite.
-
Over the past 30 years, significant upland SOC accumulation mainly showed up in Huang-Huai-Hai Plain of China (including Beijing, Tianjin municipalities, Shandong, Hebei, Henan, Jiangsu and Anhui provinces, Figs. 4, 5), while SOC in Heilongjiang Province of northeastern China declined significantly (Figs. 4, 5). Upland soils in northeastern China lost 113 Tg C over this period, and the carbon loss in Black soils of the northeastern China was most serious. For instance, the fertile Black soils in the northeastern China lost 8.3 Mg C/ha, equivalent to approximately 15% of the baseline SOCD in 1980 (~55 Mg C/ha). The decline of SOC in black soils of the northeastern China was mainly attributed to their relatively higher initial SOC content and shorter period of reclamation for agricultural purposes (Xie et al., 2007; Mao et al., 2019; Zhou et al., 2019). Overall, despite significant SOC accumulation in Chinese uplands, the mean SOCD in 2010 (34.75 Mg C/ha) was still significantly smaller than those in croplands of developed countries like the United States (44 Mg C/ha) and those in Europe (53 Mg C/ha) (Chiti et al., 2012; Adhikari et al., 2019). The relatively low SOC levels in Chinese uplands provided a prerequisite for further sequestration of more carbon in the soils, as the changes of SOC stock were greatly related to the initial SOC levels (Stewart et al., 2007; 2008, Jin et al., 2008; Huang et al., 2012; Korsaeth et al., 2014). For example, across the six major agronomic regions of China, the relationship between change in SOC and the initial SOC levels in 1980 (r = –0.86, P < 0.05) was significantly negative. This negative baseline effect could be accounted for by the method of soil carbon saturation, as low SOCD that is far from the saturation level may have higher potential and efficiency to store added C (Stewart et al., 2007; 2008). Also, soils with a high initial SOC level (i.e., the northeastern China) are liable to lose carbon as it can generate higher CO2 equivalents originating from SOC mineralisation (Korsaeth et al., 2014). This implies that Chinese upland soils are still highly likely to sequestrate more carbon in the soils, providing suitable management practices such as reduced tillage, rational fertilization, crop residue incorporation, and manure amendment. Moreover, economic and policy incentives to farmers for improving soil fertility are also indispensable (Chiti et al., 2012; Zhao et al., 2018; Liu et al., 2019). Also, this reveals that soils on a declining path can furthermore lose a lot of carbon if the management is not adapted. The first step should be stopping losses (especially on such fertile soils as black soils).
4.1. Comparison with previous studies
4.2. Uncertainties resulting from the heterogeneity of input data
4.3. Possibility for future carbon sequestration
-
There was a significant accumulation of topsoil SOC in major upland soils of China over the period of 1980–2010, especially in the Huang-Huai-Hai Plain. During this period, the SOC storage increment was 370 Tg C, with the associated uncertainty interval ranging from –440 to 1110 Tg C. The estimated uncertainty intervals for SOC storage change during the 1980s, 1990s, and 2000s were –40 to 24, –6 to 41, and 2 to 45 Tg C/yr, respectively. Although it was still uncertain whether Chinese upland soils functioned as a carbon source or sink during the first two decades, the SOC increase was definite in the subsequent decade. The relatively low SOC levels in Chinese uplands provided chances to sequestrate more carbon in the soils if rational managements were adapted. Furthermore, the changes in SOC manifested significant differences in regions and soil types. Such information and knowledge are of great significance for the credible and meaningful estimation of SOC to make decisions regarding soil fertility improvement and carbon management. Thus, identifying the sources of uncertainties in different regions, soil types and periods, and developing strategies for reducing such uncertainties are vital in future modelling.
-
We gratefully acknowledge Ms. Cindy Keough, who used to work in the Natural Resources Ecology Lab of Colorado State University, for supplying CENTURY 4.6 and providing extremely valuable advice on CENTURY model initialization.

 DownLoad: