


-
Globally, land resource are an important factor in economic development and environmental protection, particularly in coastal areas characterized by high-density cities and towns. land resource, whose sustainable management is one of the key goals in the nations’ sustainable development goals, play a vital role in human development. During rapid urbanization in developing countries, urban land development takes two main forms: intensive land use and horizontal expansion (Barbosa et al., 2015; Zhao et al., 2018b). Intensive urban land use refers to intense socio-economic activity per unit of land, whereas horizontal expansion refers to extensive urban land use for non-agricultural activities (Huang et al., 2018). In China, in particular, rapid urbanization has led to the transformation and restructuring of urban land (Ding and Lichtenberg, 2011; Hegazy and Kaloop, 2015). Considering the importance, scarcity, and limitation of land resource, it is therefore necessary to improve urban land use efficiency (ULUE) in China (Yang et al., 2014; Lu et al., 2018). This is even more important that the supply of urban land is steadily declining because of the increased protection of agricultural and ecological land, with the consequent limitation of urban land expansion (Otto et al., 2015; Bagheri and Tousi, 2018; Liu et al., 2018).
In the Yangtze River Delta, which is one of China’s most developed urban agglomerations, the area of urban construction land grew from 8552.3 km2 to 22 515.8 km2 from 2000 to 2018 (NBSC, 2019), corresponding to an average annual growth rate of 5.53%. This rapid expansion of construction land has led to a series of social and environmental problems, such as the loss of farmland, the reduction of biodiversity, and the urban heat island effect, which all have a negative impact on sustainable urban development (De Vos and Witlox, 2013; Mohajerani et al., 2017; Miller and Brewer, 2018; Lu et al., 2019; Masoudi et al., 2021). To achieve sustainable urban development, governments at various levels have advocated for endogenous urban growth with an intensive land use based on smart growth and compact development (Lee and Lim, 2018; Sciara, 2020). Thus, improving ULUE can increase sustainable urban development and unblock the bottleneck in urban land use.
ULUE describes the benefits produced per unit of urban land and reflects the ability of a region to promote the synergistic development of the society, economy, and environment (Luo et al., 2018; Zhu et al., 2019). Recent ULUE evaluations tend to involve multiple indicators, integrating environmental, social, economic, and other factors to better reflect the complex nature of ULUE (Xie and Wang, 2015; Chen et al., 2016; Wei et al., 2017; Kaur and Garg, 2019). Evaluations should also consider the undesirable outcomes of urban land development, such as environmental pollution (Huang et al., 2017; Zhu et al., 2019), whose impact can be characterized using non-parametric methods, such as the directional distance function (Wang et al., 2017) and slack-based measurement (SBM). Moreover, ULUE research has been conducted across multiple scales, such as the national, watershed, provincial and urban agglomeration scales, revealing significant spatial variability among regions (Chen et al., 2019). However, there are still many research gaps in the ULUE literature. First, most studies have focused on a limited number of desirable outputs (such as social welfare and economic benefits) and ignored undesirable outputs such as air pollution, carbon emissions, and industrial waste emissions. This may lead to distortion of the results. Second, few studies have decomposed ULUE into pure technical efficiency (PTE) and scale efficiency (SE). Technical and scale efficiencies can be used to determine the degree and direction of factors contributing to ULUE, which can enrich our understanding of ULUE. Third, few studies have explored the potential for improving ULUE while reducing the negative environmental inputs as much as possible. For this, it is important to determine the interaction between the improvement potential and efficiency level under given technical conditions. Therefore, we posed the following questions: 1) How can ULUE be accurately evaluated under the current environmental constraints in China? 2) What are the main contributors to changes in ULUE? 3) How can the ratio of input-to-output production factors be adjusted to improve ULUE?
To answer these questions, taking the Yangtze River Delta as an example, the aim of this study was to measure ULUE and estimate the contributing factors. First, undesirable outputs (e.g., pollution) were incorporated into the data envelopment analysis (DEA) analysis method to build a complete and reliable evaluation model of ULUE based on slack-based measure-undesirable (SBM-UN) model. Second, the SBM-UN model was used to measure the comprehensive efficiency of land use, PTE, and SE. Through this method, the main reasons for the change of ULUE can be found out quantitatively. Third, the improvement potential of ULUE was determined by exploring the degree of input redundancy, desirable output insufficiency, and undesirable output excess. We then reported the spatial-temporal variation of ULUE in the Yangtze River Delta and determined the relative contributions of PTE and SE to ULUE. Last, we suggested ways to improve ULUE. Through this, we can fully understand the current situation of urban land use, which is conducive to achieve intensive and efficient use of urban land resource and provide scientific evidence for high-quality development in the Yangtze River Delta.
-
The Yangtze River Delta, is located on the east coast of China and belongs to the core region of China’s urbanization (Fig. 1). Covering Shanghai City, Jiangsu Province, Zhejiang Province, and Anhui Province, the Yangtze River Delta includes 26 closely-linked prefecture-level cities. It is also at the nexus of two national strategies, namely, the One Belt One Road Initiative and the Yangtze River Economic Belt Development Strategy, both of which play important roles in enhancing China’s participation in international markets. Since the 21st Century, rapid urbanization and industrialization in the Yangtze River Delta have resulted in the excessive expansion of construction land and a subsequent reduction of ecological space (Yang et al., 2014; Luo et al., 2018; Yuan et al., 2020). In 2018, the Yangtze River Delta covered an area of 211 700 km2, with a GDP of 17.86 trillion yuan RMB and a permanent population of 154 million people, accounting for 2.21%, 19.84%, and 11.04% of the total area, GDP, and population of the whole country, respectively (NBSC, 2019). Thus, the growing demand for construction land in the area may cause increasing conflict between regional development and environmental protection.

Figure 1. Location of the Yangtze River Delta, China
-
To calculate ULUE, we considered the comprehensive land use benefits to the development of economy, society, and environment. Negative environmental effects were also included in the index system (Luo et al., 2018; He et al., 2020; Kuang et al., 2020; Table 1). Following the Cobb-Douglas production function (Huang et al., 2017), the selected input indicators were the urban construction land area, fixed asset investment, and number of employees in secondary and tertiary industries. The output indicators were divided into two groups of desirable and undesirable outputs. The desirable output indicators reflected positive outputs in the city’s production and operation activities within a certain period of time. These included economic, social, and environmental benefits, and more specifically, the added value of secondary and tertiary industries, the average wages of employees, and green land coverage in built-up areas, respectively. Unde-sirable output indicators included wastewater discharge, industrial SO2 emissions, and smoke discharge, which were used to characterize negative environmental effects in the process of urban socio-economic development.
Table 1. Evaluation index system used to measure urban land use efficiency (ULUE)
Criterion layer Factor layer Indicator layer Unit Input Land input Urban construction land area km2 Capital input Investment in fixed assets 100 million yuan RMB Workforce input Number of employees in secondary and tertiary industries 10 000 persons Desirable output Economic benefit Added value of secondary and tertiary industries 100 million yuan RMB Social benefit Average wage of employees Yuan RMB Environmental benefit Green coverage of built-up area % Undesirable output Negative environmental effect Wastewater discharge 10 000 t Industrial SO2 emissions t Smoke discharge t -
The SBM model is proposed by Tone (2001), which was derived from non-radial and non-angle models. It comprehensively considers the input and output of each decision-making unit (DMU), but does not take into account undesirable outputs such as the environmental negative effects due to urban land use. That is, the relaxation variable is directly put into the objective function to solve the problem of input-output slacks. In other words, we used this concept to develop the SBM-UN model, which additionally considers undesirable outputs, resulting in more accurate ULUE evaluations in the context of increasing environmental restrictions.
The principle of the model is as follows. Supposing there are n decision making units (DMU), each consumed m inputs and produced s1 desirable outputs and s2 undesirable outputs, expressed as
$ x\in {R}_{m} $ ,$ {y}^{g}\in {R}_{s1} $ , and$ {y}^{b}\in {R}_{s2} $ , respectively (Liu et al., 2017; Chen et al., 2020). Additionally,$ X $ ,$ {Y}^{g} $ , and$ {Y}^{b} $ are defined as$ X=\left({x}_{1}{,x}_{2}{,\dots ,x}_{n}\right)\in {R}_{m\times n} $ ,$ {Y}^{g}=({y}_{1}^{g},{y}_{2}^{g},\dots ,{y}_{n}^{g})\in {R}_{s1\times n} $ , and$ {Y}^{b}=({y}_{1}^{b},{y}_{2}^{b},\dots ,{y}_{n}^{b})\in {R}_{s2\times n} $ , respectively. Based on the actual input-output, assuming$ X > 0 $ ,$ {Y}^{g} > 0 $ , and$ {Y}^{b} > 0 $ , the set of production possibilities is P. That is, all combinations of desirable and undesirable outputs produced by the input factor x is defined as follows:$$ \begin{split} \\ P=\left\{(x,{y}^{g},{y}^{b})\left|x\ge X\lambda ,{y}^{g}\ge {Y}^{g}\lambda ,{y}^{b}\ge {Y}^{b}\lambda ,\lambda \ge 0\right.\right\} \end{split}$$ (1) According to this definition, the SBM-UN model with undesirable outputs is defined as follows:
$$ \;{\rho }^{*}=\mathrm{min}\dfrac{1-\dfrac{1}{m}{\displaystyle\sum _{t=1}^{m}}\dfrac{{s}_{i}^-}{{x}_{i0}}}{1+\dfrac{1}{{s}_{1}+{s}_{2}}\left({\displaystyle\sum _{r=1}^{{s}_{1}}}\dfrac{{s}_{r}^{g}}{{y}_{r0}^{g}}+{\displaystyle\sum _{r=1}^{{s}_{2}}}\dfrac{{s}_{r}^{b}}{{y}_{r0}^{b}}\right)} $$ (2) $$ s.t.\left\{\begin{array}{l}{x}_{0}=X\lambda +{s}^-;{y}_{0}^{g}={Y}^{g}\lambda -{s}^{g};{y}_{0}^{b}={Y}^{b}\lambda +{s}^{b}\\ {s}^-\ge 0,{s}^{g}\ge 0,{s}^{b}\ge 0,\lambda \ge 0\end{array}\right. $$ (3) where
$ {s}_{i}^{-} $ is the input slack, and$ {s}_{r}^{g} $ and$ {s}_{r}^{g} $ are the desirable and undesirable output slacks, respectively; λ is the weight variable that determines the scale effect of each DMU.$\; {\rho }^{*} $ is the comprehensive efficiency of DMU;$0 < \rho^{*} \le 1$ . When$0 < \rho^{*} \le 1$ , all slacks satisfy$ {s}_{i}^{-}={s}_{r}^{g}={s}_{r}^{b}=0 $ , and the DMU is efficient. If$\rho^{*} < 1$ , the DMU is inefficient, and the input and output should be improved, the values of slack variables X, Yg, and Yb could be used to determine potential approaches to improve ULUE. The model is a nonlinear programming model; however, it can be transformed into a linear programming model using the transformation method of Charnes-Cooper (Lu et al., 2018; Yu et al., 2019). -
Kernel density estimation (KDE) is an important non-parametric estimation method that is often used to quantify the disparity of quantitative elements in economics. KDE obtains continuous density curves by measuring the probability density, which can describe the distribution of random variables (Katkovnik and Shmulevich, 2002; Xu et al., 2015). Specifically, if f(x) is the probability density function estimated according to the value of ULUE, and x1, x2, ···, xn are samples of continuous X, the KDE estimation formula is:
$$ f\left(x\right)=\frac{1}{nh}{\sum _{i}^{n}}K\left(\frac{x-{x}_{i}}{h}\right) $$ (4) where
$ K(\cdot ) $ is the kernel function, h is the bandwidth, n is the number of samples, and i = 1, 2…n. To ensure the rationality of the KDE estimation results, the kernel function should satisfy$K\left(x\right)\ge 0,{\displaystyle\int }_{-\infty }^{+\infty }K\left(x\right){\rm{d}}x=1$ . More-over,$ K(\cdot ) $ should fit the morphological characteristics of the density function. Considering that the accuracy of the estimation results is rarely affected by the kernel function, this study used the common Epanechnikov kernel function (Kuang et al., 2020).$$ K\left(x\right)=\frac{1}{\sqrt{2\text{π} }}{{\rm{exp}}}\left(-\frac{{x}^{2}}{2}\right) $$ (5) The kernel density function is sensitive to the choice of bandwidth (h) (Katkovnik and Shmulevich, 2002). At higher bandwidth, the variance of KDE is smaller, and the density function curve is smoother. However, the smoothness of the curve may mask the characteristics of the data and reduce the accuracy of the evaluation results (Kuang et al., 2020). When the bandwidth is low, the variance of the KDE is large. As it is difficult to remove noise in the random error, the curve is not smooth, but the results can be more accurate. Therefore, it is important to use as low a bandwidth as possible. When h is a function of n, h(n) needs to satisfy the assumption: if n→∞, h(n)→∞.
-
The SBM-UN model described in Section 2.3.1 assumes that the return to scale remains unchanged. The efficiency result represents the comprehensive efficiency, which is TE. Under variable returns to scale (VRS), the condition
${\displaystyle\sum\limits_{i=1}^{i=n}}{\lambda }_{i}=1$ should be added to the constraints. At this point, the efficiency result represents the PTE. The SE can then be defined as follows (Yu et al., 2019):$$ S E=\frac{T E}{PT E} $$ (6) The PTE of DMU is used to represent the intensity of ULUE, reflecting the production technology level, resource utilization, allocation level, and sustainable performance of a city. SE is the benefit of the unit input during land use for urban extension and the change trend of ULUE, which reflects the population scale effect, industrial agglomeration, market capacity etc. (Zhu et al., 2019). TE represents the performance of current and future land use scales (González et al., 2015). Therefore, the DEA model based on VRS can identify the causes of low ULUE, including inefficient production and adverse conditions. When SE = 1, the DMU has an effective land use scale (Zhao et al., 2018a).
-
In this study, 26 prefecture-level cities were used as the decision-making units (DMUs) to examine ULUE. The data were mainly obtained from public information sources, including the China Urban Construction Statistical Yearbook (MHURC, 2001–2019), China Urban Statistical Yearbook (NBSC, 2001–2019), and the statistical yearbooks of the individual cities in the Yangtze River Delta. To eliminate the effects of price factors, indicators of the annual average balance of net fixed assets and gross industrial output value above a designated value were converted to constant prices based on the year 2000 using the index of investment in fixed assets and ex-factory price indices of industrial products, respectively. When processing foreign direct investment (FDI) data, we first converted the amount into RMB according to the exchange rate of USD/RMB in 2000. The moving average method was used to account for missing data in individual years. Thus, we obtained city-level data of the Yangtze River Delta from 2000 to 2018.
This study used established models to analyze the data according to the following steps. First, we used the SBM model to measure the TE of the original data. The SBM model was also used to measure ULUE without undesirable outputs to determine the impact of adding undesirable outputs to the model. Second, spatial distribution diagrams were mapped using ArcGIS 10.2 (Environmental Systems Research Institute, United States). The kernel densities of ULUE in 2000, 2005, 2010, 2015, and 2018 were estimated using the Graph function in Eviews 10.0 (Quality Management System, United States). Finally, the SBM-UN model was used to determine the improvement potential of each ULUE variable in 2018 using the original input-output data (Yang et al., 2014; Liu et al., 2020). The SBM-UN model allowed the production of a dataset, which not only contained the ULUE of each city, but also included the proportion data of input redundancy, insufficient desirable output and excess undesirable output.
-
Fig. 2 shows the average ULUE in the Yangtze River Delta from 2000 to 2018. The results from the SBM-UN model were significantly lower than those from the SBM model, owing to the negative impact of undesirable outputs and the fact that the input-output slack was overestimated in the SBM model. Without considering the undesirable outputs, the input-output slack in the SBM model was overestimated, which distorted the evaluation results. This suggests that SBM-UN model results reflect the actual ULUE more accurately. The SBM-UN model results showed an overall decrease in ULUE of 19.06%, and the average value of ULUE from 2000 to 2018 was 0.681. The highest value on ULUE was 0.746 in 2018. The lowest value (0.605) was observed in 2009. Overall, ULUE from 2000 to 2018 exhibited a U-shaped trend.

Figure 2. Urban land use efficiency in the Yangtze River Delta of China from 2000 to 2018
To account for the interannual variation in ULUE, we divided the results into two stages. In the first stage (2001−2009), ULUE in the Yangtze River Delta was low. During this time, China joined the World Trade Organization and experienced rapid development. The Yangtze River Delta attracted considerable foreign investment and developed an export-oriented economy. Many cities, villages, and towns expanded, and industrial and university districts were established. For example, in Jiangsu Province, nine national and 71 provincial development zones were established, covering a total approved area of 830 km2. However, the actual developed area was larger (Chen et al., 2019). This economic development led to a rapid reduction in the cultivated land area. Owing to the low level of industrial development and disorderly spread of construction land, ULUE was low. Combined with the actual situation of urban development in the Yangtze River Delta, the rapid economic development consumed a lot of resources. Therefore, increasing land supply has not been the best way to improve ULUE.
The second stage lasted from 2010 to 2018, a period during which ULUE increased significantly. This was mainly due to a shortage in the supply of construction land. Additionally, policies restricting economic development zones and protecting farmland were formulated by all levels of government, which enhanced land use intensity. Moreover, the significant impact of the global economic crisis made the export-oriented and extensive economy of the Yangtze River Delta unsustainable.
-
Spatial disparities in ULUE were notable across the Yangtze River Delta (Fig. 3). In 2000, Shanghai, Hangzhou, and Ningbo, the three main cities in the Yangtze River Delta, exhibited the highest land use efficiency and intensity level, likely due to good economic and land management policies. However, the average ULUE for Yancheng, Nantong, Tongling, and Taizhou together was only 0.526, far below the average value for the Yangtze River Delta. The ULUE of Maanshan and Chuzhou decreased significantly over the study period, with an annual decrease of 18.8% and 13.5%, respectively. In 2010, low-ULUE cities were unevenly distributed across the Yangtze River Delta. In 2015 and 2018, Shanghai, Suzhou, Nanjing, Hangzhou, Ningbo, and other regional central cities exhibited higher land use efficiency. These cities were mainly located in the ‘Z’ development axis along the Shanghai–Nanjing, Shanghai–Hangzhou, and Hangzhou–Ningbo railway in the Yangtze River Delta and showed a clear hierarchical distribution.

Figure 3. Regional patterns of urban land use efficiency in the Yangtze River Delta of China in 2000, 2005, 2010,2015 and 2018
The local governments of high-ULUE cities paid more attention to environmental protection, had reasonable resource allocation, and set higher industrial introduction thresholds than cities with low development levels (such as Taizhou, Yancheng, and Tongling). For example, Nanjing adaptively reused the waste land of an industrial park, thereby increasing ULUE (Gao and Yuan, 2017). Conversely, marginal cities in the Yangtze River Delta, such as Anqing, Chuzhou, and Yancheng, were in the initial stage of economic expansion and exhibited low industrial levels. Owing to incomplete sustainable land use policies, these cities followed a traditional development model that relied exclusively on increasing land supply to drive economic growth, resulting in low ULUE. The cities with different levels of ULUE showed significant differentiation along the characteristics of ‘large agglomeration’ and ‘small dispersion’ (most of the cities are concentrated, and the rest are scattered in space). The imbalance in spatio-temporal patterns in ULUE was more prominent, similarly to the findings in developed urban areas in the European Union and North America (Williams et al., 2002; Muscat et al., 2022).
The kernel density of ULUE for 2000–2018 is shown in Fig. 4. During the study period, the center of the density curve first moved to the left and then to the right, the number of peaks remained at two, and the peak width decreased significantly. This indicates that the ULUE of the Yangtze River Delta gradually increased, and the difference between cities decreased. From 2000 to 2018, the kernel density followed a bimodal distribution, with most cities falling into two ULUE categories (Lu et al., 2018). Some cities in the Yangtze River Delta had a relatively low ULUE due to insufficient implementation of land use policies (Tan et al., 2005; Guo et al., 2014; Jin et al., 2019). However, other cities paid attention to environmental protection and rational resource allocation. The threshold of industry introduction was higher than that of poorly-developed cities, which led to the relatively intensive utilization of construction land. This will inevitably result in the polarization of ULUE in the Yangtze River Delta (Lu et al., 2018).

Figure 4. Kernel density distribution of urban land use efficiency in the Yangtze River Delta of China
As shown in Fig. 4, the density curve in 2000 has a main peak and a secondary peak, corresponding to cities with the high and sub-high ULUE, respectively. The density of the secondary peak was significantly lower than that of the main peak. From 2000 to 2010, the right end of the density curve gradually moved to the right, whereas the left end moved to the left, indicating a reduction in the gap between the high and low-ULUE cities in the Yangtze River Delta. Compared with 2000, the height of the main peak increased and that of the secondary peak decreased in 2005, resulting in a bimodal distribution. The width and height of the kernel density distribution continued to decline in 2010, again indicating a decrease in the difference in ULUE in the Yangtze River Delta. Only one peak was observed in 2015. However, similar to 2000 and 2005, the kernel density curve in 2018 also followed a bimodal distribution. In addition, the density value of the main peak was far lower than that of the secondary peak, which contrasted with the distribution pattern in 2005 and 2015. Over time, it is expected that cities would gradually move from the high-ULUE group into the low-ULUE group at the varying speeds, with the disparities in ULUE showing the ‘club convergence’ feature.
-
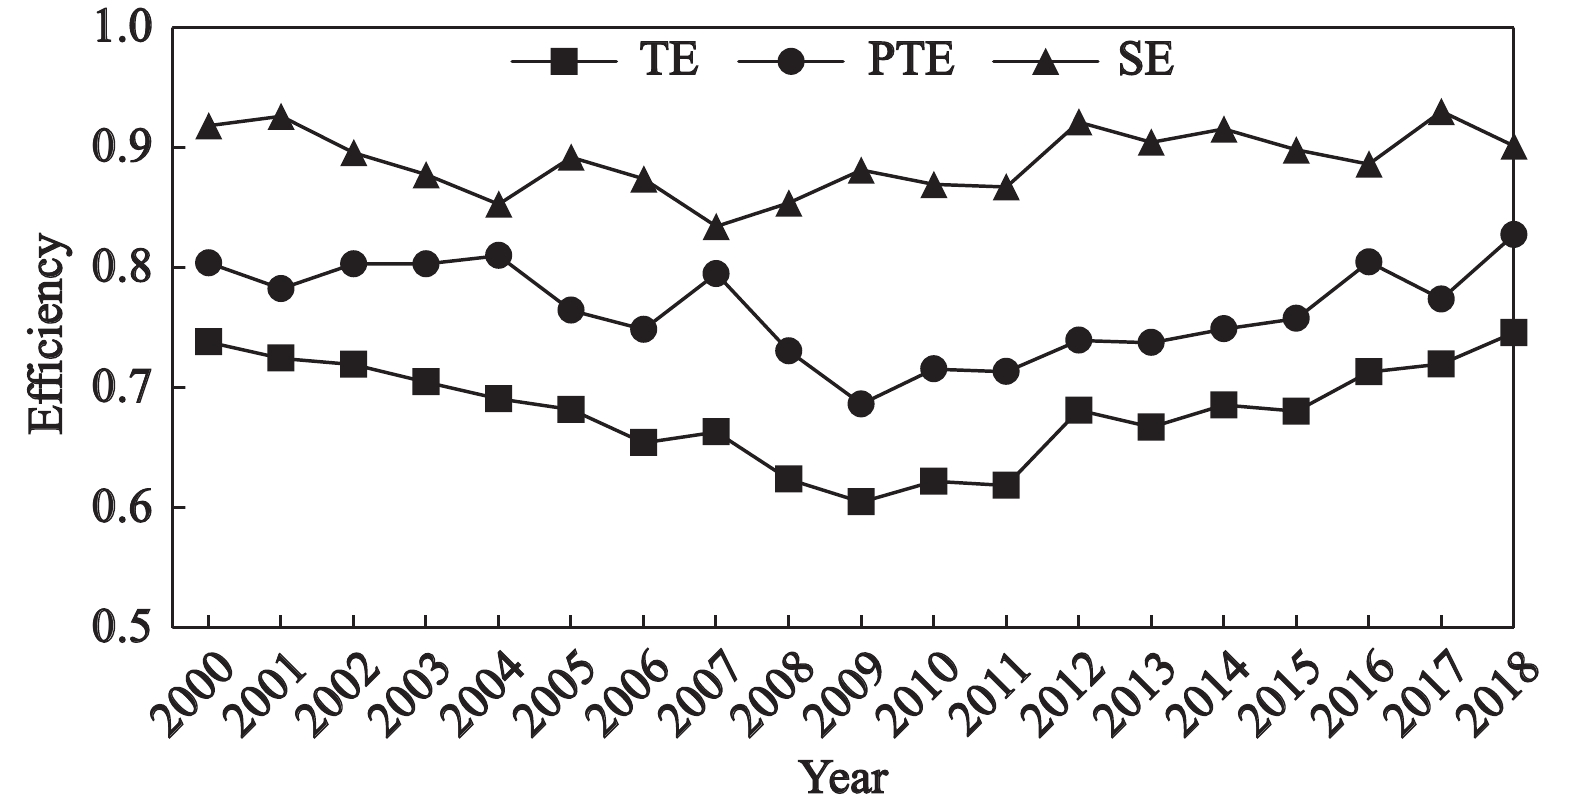
According to the results of efficiency decomposition, we can explore the main contributors to the dynamic evolution of ULUE. Thus, we calculated the TE, PTE, and SE of the 26 cities in the Yangtze River Delta from 2000 to 2018 (Fig. 5). The average PTE and SE values were 0.766 and 0.889, respectively. The correlation coefficient between PTE and TE was 0.823 and that between SE and TE was 0.917.

Figure 5. Technical efficiency (TE), pure technical efficiency (PTE), and scale efficiency (SE) of urban land use efficiency in the Yangtze River Delta from 2000 to 2018
Through the above analysis, we found that the values of PTE and SE helped to explain the contributors of TE. The plots indicate the inner cities in the Yangtze River Delta. Fig. 6 shows the relationships between TE and both PTE and SE. According to the scatter plots, the points vary considerably in distance from the 45° line, indicating that TE is affected by both PTE and SE (Yang et al., 2013; Yu et al., 2019). Fig. 6a indicates that PTE shows more similarity to TE than SE and the low level of TE in the Yangtze River Delta is mainly caused by PTE. However, more points in Figure 6b lie in the upper part of the scatter plot, indicating that SE contributes more to TE than PTE.

Figure 6. Decomposition analysis showing the relative contributions of pure technical efficiency (PTE) and scale efficiency (SE) to the technical efficiency (TE)
Shanghai, Hefei, Nanjing, Suzhou, and Wuxi had the highest TE in 2000–2018 (Table 2). These cities are located in the core economic and social development area of the Yangtze River Delta and show intensive land use. Conversely, the TEs of Anqing and Yancheng were only 0.463 and 0.472, respectively. In these cities, urban land use is extensive, and investment in pollution treatment and environmental protection technologies is insufficient. Thus, land use in these cities should be altered, and environmental pollution should be controlled to increase ULUE. Shanghai, Nanjing, and Suzhou had an average PTE of 0.967, which was almost 46.98% higher than that of Xuancheng, Yancheng, and Anqing. In contrast, Zhoushan, Chizhou, and Tongling, which are located in marginal social and economic development areas of the Yangtze River Delta with a sufficient supply of construction land, had the highest SE. Cities such as Huzhou, Shaoxing and Jiaxing have underwent rapid development of industrialization and urbanization, resulting in high land development intensity and a limited supply of construction land, which made their average SE low, only 0.822. In contrast to previous studies (Lu et al., 2018; Yu et al., 2019), we observed no significant linear relationship between efficiency and scale in the Yangtze River Delta. This could be due to the high integration and low input-output gap between the unit area and unit labor force. Therefore, the disparities among cities in the Yangtze River Delta should be given more attention. The most suitable strategy was to improve the ULUE of cities located in marginal areas.
Table 2. Average technical efficiency (TE), pure technical efficiency (PTE) and scale efficiency (SE) of urban land use efficiency of cites in the Yangtze River Delta of China from 2000 to 2018
Ctiy TE PTE SE Ctiy TE PTE SE Shanghai 1.000 1.000 1.000 Huzhou 0.621 0.784 0.792 Nanjing 0.885 0.969 0.913 Shaoxing 0.612 0.738 0.829 Wuxi 0.862 0.866 0.995 Jinhua 0.727 0.729 0.998 Changzhou 0.711 0.757 0.939 Zhoushan 0.819 0.819 1.000 Suzhou 0.871 0.931 0.935 Taizhou 0.744 0.824 0.903 Nantong 0.717 0.834 0.859 Hefei 0.913 0.917 0.996 Yancheng 0.472 0.510 0.924 Chuzhou 0.703 0.762 0.922 Yangzhou 0.761 0.837 0.910 Maanshan 0.604 0.652 0.927 Zhenjiang 0.732 0.785 0.932 Wuhu 0.602 0.622 0.968 Taizhou 0.658 0.730 0.902 Xuancheng 0.498 0.509 0.979 Hangzhou 0.681 0.793 0.859 Tongling 0.566 0.566 1.000 Ningbo 0.806 0.840 0.959 Chizhou 0.804 0.804 1.000 Jiaxing 0.510 0.604 0.844 Anqing 0.463 0.518 0.894 -
We selected the urban land use data in 2018 for the improvement potential analysis of each variable (Table 3).
Table 3. Input-output adjustment and improvement potential of each urban land use efficiency index for various cities in the Yangtze River Delta in 2018
DMU Score Input redundancy Output shortage Output excess Urban construction land area Investment in
fixed assetsNumber of employees in
secondary
and tertiary industriesAdded value of secondary and tertiary industries Average wage of
employeesGreen coverage of
built-up areasWastewater
dischargeIndustrial SO2
emissionsSmoke
dischargeShanghai 1 0 0 0 0 0 0 0 0 0 Nanjing 1 0 0 0 0 0 0 0 0 0 Wuxi 1 0 0 0 0 0 0 0 0 0 Changzhou 0.641 598.10
(54.47)0 0 0 12686.98
(14.97)0 4256.53
(31.97)16453.83
(58.42)33253.27
(60.55)Suzhou 1 0 0 0 0 0 0 0 0 0 Nantong 1 0 0 0 0 0 0 0 0 0 Yancheng 0.374 592.41
(62.60)992.74
(33.63)124.11
(36.50)0 51474.07
(80.08)7.26
(17.21)6181.88
(56.18)14921.47
(77.80)9304.11
(63.98)Yangzhou 0.590 430.05
(54.37)631.30
(24.80)0 0 29902.10
(41.73)0 1599.14
(23.58)6977.23
(62.31)1662.98
(21.47)Zhenjiang 1 0 0 0 0 0 0 0 0 0 Taizhou 0.585 611.93
(63.37)576.12
(23.12)1.05
(0.48)0 32 559.76
(49.70)0 0 6943.03
(59.24)1271.17
(18.89)Hangzhou 0.588 521.22
(38.76)727.12
(16.84)64.68
(10.52)0 29050.36
(30.05)8.89
(22.24)11728.30
(47.76)19593.96
(73.95)3580.35
(21.91)Ningbo 0.516 828.66
(55.78)680.92
(18.44)84.03
(16.30)0 30482.02
(33.24)9.21
(23.12)4434.92
(30.74)19569.51
(76.64)9626.74
(48.81)Jiaxing 0.447 399.46
(55.64)553.30
(24.94)105.66
(34.67)0 6749.44
(8.14)0 15194.43
(77.15)18987.06
(84.33)6181.34
(56.44)Huzhou 0.550 216.86
(50.76)0 37.39
(22.27)0 22092.02
(30.54)0 5971.13
(70.50)16000.27
(72.34)7746.85
(51.51)Shaoxing 0.415 1504.08
(80.60)427.50
(18.61)75.45
(24.90)0 30 897.68
(45.78)0 19899.69
(79.42)14944.61
(79.15)4098.40
(42.97)Jinhua 0.512 383.61
(57.04)26.15
(1.61)104.15
(37.08)0 11617.08
(14.13)0 2 454.57
(38.33)10250.95
(74.74)10776.87
(71.55)Zhoushan 1 0 0 0 0 0 0 0 0 0 Taizhou 0.614 246.85
(40.05)0 116.41
(34.51)0 38 194.28
(53.93)0 632.02
(12.33)4339.26
(42.94)2230.18
(25.39)Hefei 1 0 0 0 0 0 0 0 0 0 Chuzhou 0.426 134.45
(47.13)235.34
(17.21)109.83
(58.70)0 26 210.62
(38.97)0 802.53
(34.01)13485.68
(83.12)5779.70
(73.77)Maanshan 0.614 21.99
(11.51)0 11.66
(11.42)0 26297.37
(36.62)0 6 790.48
(78.95)34186.86
(91.02)65408.58
(95.68)Wuhu 0.585 41.53
(14.77)403.40
(21.78)31.70
(18.45)0 29683.77
(44.38)0 515.53
(14.42)36051.05
(91.70)23614.89
(87.18)Xuancheng 0.451 171.29
(56.78)77.84
(6.95)70.49
(52.14)0 22796.39
(33.15)0 405.58
(25.04)9858.37
(76.56)10440.01
(81.75)Tongling 1 0 0 0 0 0 0 0 0 0 Chizhou 1 0 0 0 0 0 0 0 0 0 Anqing 0.354 443.34
(73.17)193.28
(13.83)140.71
(62.59)0 40021.81
(68.64)0 953.08
(35.84)9479.14
(76.57)5145.02
(69.81)Note: Data in parentheses indicate the percentage (%) of the input-output adjustment and improvement potential of each index.
DMU: decision-making unitAcross the region, the average proportion of redundant investment in fixed assets was 8.53%, whereas the output of average wage of employees was less than 24%. Moreover, the industrial SO2 emissions exceeded 45.42% of the national standard. Our results showed that the cities with low ULUE generally experienced the phenomenon of redundant inputs, serious environmental pollution, and excessive undesired outputs, which made the utilization of land resource inefficient. Meanwhile, large variations were observed among cities. For example, the redundancy ratio of urban land in Shaoxing was 80.60%, whereas that in Maanshan was 11.51%. Thus, the scale and structure of the input elements in some cities were not reasonable, spatial allocation of land resource was inefficient, and the undesirable outputs were too high. Furthermore, the effective outputs of most cities were insufficient. Therefore, the results of the SBM-UN model can be used by each city to adjust their input–output factors to increase ULUE. In summary, the ULUE in most cities could be improved by increasing the intensity of capital investment, optimizing the spatial allocation of factors, reducing the negative external output, and increasing the effective output. To improve the overall ULUE in the Yangtze River Delta, it is necessary to increase the PTE, strengthen management and adjust the land use structure.
-
We investigated 26 cities in the Yangtze River Delta and developed a novel ULUE evaluation model (the SBM-UN model), which considers undesirable outputs to assess ULUE more accurately. We also determined the spatiotemporal patterns of ULUE in the Yangtze River Delta and the factors contributing to ULUE, as well as potential ways to improve ULUE. Our results showed that the proposed model is an effective planning tool for improving ULUE that can be used in other megacity regions across the world. The conclusions of this empirical study are summarized as follows: 1) ULUE in the Yangtze River Delta was relatively low from 2000 to 2018 and followed a U-shaped trend. Moreover, including undesirable outputs such as environmental pollution in the SBM-UN model had a negative impact on ULUE, reducing it by 19.06%. This finding indicated that neglecting the effect of undesirable outputs results in an overestimation of ULUE. 2) The spatial distribution pattern of ULUE revealed significant regional differences. The ULUE of central cities in the Yangtze River Delta (such as Shanghai, Hangzhou, and Ningbo) remained high throughout the study period, whereas those of Yancheng in Jiangsu, Taizhou in Zhejiang, and Tongling in Anhui were low. According to kernel density estimation, ULUE in the Yangtze River Delta gradually declined and was accompanied by spatial polarization. The levels of economic development and ULUE were associated. 3) PTE contributed more to the evolution trend of TE, whereas SE contributed more to the change in ULUE. Overall, the contribution of SE was larger than that of PTE. Our findings also illustrated that, by strictly managing the scale of new construction land, we can effectively avoid land use waste and improve ULUE. 4) Cities with low ULUE generally had redundant inputs, insufficient outputs, and excessive negative environmental outputs.
Based on these results and previous empirical studies, we present several policy implications for promoting intensive land use and improving ULUE for cities in the Yangtze River Delta. For cities with low ULUE (such as Anqing, Tongling, and Yangzhou), in addition to developing urban economy, it is necessary to improve environmental quality, limit the scale of land expansion, revitalize the stock of construction land, and develop low-efficiency land. Additionally, further attention should be paid to realize land intensive development and green development based on regional natural resources and environmental capacity. Conversely, cities with high ULUE should focus on the optimal allocation of land resource and technological innovation. A change from capital-driven to innovation-driven development could further improve ULUE. Furthermore, measures such as industrial upgrading and structural optimization should be considered to improve ULUE. Finally, in view of the current regional differences in ULUE, urban authorities should employ big-data analysis and simulations to improve the planning of new urban spaces. Especially for regional integration planning in the Yangtze River Delta, it is necessary to clarify the function and orientation of each city in order to ensure that further development balances or reduces regional differences in ULUE. Nevertheless, we acknowledge some limitations to this study. Due to the unavailability of other relevant data, the negative environmental outputs in the SBM-UN model only included wastewater discharge, industrial SO2 emissions, and smoke discharge. Such limitations in the statistical indicators may result in biased evaluation results. With the release of more detailed data, information on other negative indicators of urban land use, such as organic compounds and carbon dioxide, could be collected. Incorporating these data into the model would improve the accuracy of the results in future studies. In addition, we examined ULUE at the city scale. Future studies should explore ULUE variation within cities to take into account the much larger city administrations found in China compared to other countries. Furthermore, the use of a smaller analytical unit, such as the county unit, could improve sample coverage and produce evaluation results that more accurately represent local conditions.
Urban Land Use Efficiency and Contributing Factors in the Yangtze River Delta Under Increasing Environmental Restrictions in China
-
Abstract: Evaluating urban land use efficiency (ULUE) provides insights into the interactions between land use systems and their external environment. Specifically, changes in ULUE are important for monitoring urban transformation in developing countries. In this study, using a traditional input-output index model, we incorporated slack-based measurements and undesirable outputs into a SBM-UN (slack-based measure-undesirable) model to investigate ULUE within the context of increasing environmental restrictions in China. The model was used to estimate the ULUE of 26 cities in the highly developed urban agglomeration of the Yangtze River Delta from 2000 to 2018. The average ULUE in the Yangtze River Delta was relatively low compared to that of developed city regions in the European Union (EU) and North America and exhibited a U-shaped curve over the study period. Incorporating undesirable outputs, such as environmental pollution, into the model reduced ULUE by 19.06%. ULUE varied spatially, with the kernel density estimation exhibiting a bimodal distribution. Efficiency decomposition analysis showed that scale efficiency made a greater contribution to ULUE than pure technical efficiency. Based on our findings, recommended approaches to improve ULUE include optimizing factor allocation, reducing undesirable outputs, and increasing the effective output per land unit. The study suggests that ULUE and the SBM-UN model are useful planning tools for sustainable urban development.
-
Figure 2. Urban land use efficiency in the Yangtze River Delta of China from 2000 to 2018
Figure 3. Regional patterns of urban land use efficiency in the Yangtze River Delta of China in 2000, 2005, 2010,2015 and 2018
Figure 4. Kernel density distribution of urban land use efficiency in the Yangtze River Delta of China
Figure 5. Technical efficiency (TE), pure technical efficiency (PTE), and scale efficiency (SE) of urban land use efficiency in the Yangtze River Delta from 2000 to 2018
Figure 6. Decomposition analysis showing the relative contributions of pure technical efficiency (PTE) and scale efficiency (SE) to the technical efficiency (TE)
Table 1. Evaluation index system used to measure urban land use efficiency (ULUE)
Criterion layer Factor layer Indicator layer Unit Input Land input Urban construction land area km2 Capital input Investment in fixed assets 100 million yuan RMB Workforce input Number of employees in secondary and tertiary industries 10 000 persons Desirable output Economic benefit Added value of secondary and tertiary industries 100 million yuan RMB Social benefit Average wage of employees Yuan RMB Environmental benefit Green coverage of built-up area % Undesirable output Negative environmental effect Wastewater discharge 10 000 t Industrial SO2 emissions t Smoke discharge t  下载: 导出CSV
Table 2. Average technical efficiency (TE), pure technical efficiency (PTE) and scale efficiency (SE) of urban land use efficiency of cites in the Yangtze River Delta of China from 2000 to 2018
Ctiy TE PTE SE Ctiy TE PTE SE Shanghai 1.000 1.000 1.000 Huzhou 0.621 0.784 0.792 Nanjing 0.885 0.969 0.913 Shaoxing 0.612 0.738 0.829 Wuxi 0.862 0.866 0.995 Jinhua 0.727 0.729 0.998 Changzhou 0.711 0.757 0.939 Zhoushan 0.819 0.819 1.000 Suzhou 0.871 0.931 0.935 Taizhou 0.744 0.824 0.903 Nantong 0.717 0.834 0.859 Hefei 0.913 0.917 0.996 Yancheng 0.472 0.510 0.924 Chuzhou 0.703 0.762 0.922 Yangzhou 0.761 0.837 0.910 Maanshan 0.604 0.652 0.927 Zhenjiang 0.732 0.785 0.932 Wuhu 0.602 0.622 0.968 Taizhou 0.658 0.730 0.902 Xuancheng 0.498 0.509 0.979 Hangzhou 0.681 0.793 0.859 Tongling 0.566 0.566 1.000 Ningbo 0.806 0.840 0.959 Chizhou 0.804 0.804 1.000 Jiaxing 0.510 0.604 0.844 Anqing 0.463 0.518 0.894
下载: 导出CSV
Table 3. Input-output adjustment and improvement potential of each urban land use efficiency index for various cities in the Yangtze River Delta in 2018
DMU Score Input redundancy Output shortage Output excess Urban construction land area Investment in
fixed assetsNumber of employees in
secondary
and tertiary industriesAdded value of secondary and tertiary industries Average wage of
employeesGreen coverage of
built-up areasWastewater
dischargeIndustrial SO2
emissionsSmoke
dischargeShanghai 1 0 0 0 0 0 0 0 0 0 Nanjing 1 0 0 0 0 0 0 0 0 0 Wuxi 1 0 0 0 0 0 0 0 0 0 Changzhou 0.641 598.10
(54.47)0 0 0 12686.98
(14.97)0 4256.53
(31.97)16453.83
(58.42)33253.27
(60.55)Suzhou 1 0 0 0 0 0 0 0 0 0 Nantong 1 0 0 0 0 0 0 0 0 0 Yancheng 0.374 592.41
(62.60)992.74
(33.63)124.11
(36.50)0 51474.07
(80.08)7.26
(17.21)6181.88
(56.18)14921.47
(77.80)9304.11
(63.98)Yangzhou 0.590 430.05
(54.37)631.30
(24.80)0 0 29902.10
(41.73)0 1599.14
(23.58)6977.23
(62.31)1662.98
(21.47)Zhenjiang 1 0 0 0 0 0 0 0 0 0 Taizhou 0.585 611.93
(63.37)576.12
(23.12)1.05
(0.48)0 32 559.76
(49.70)0 0 6943.03
(59.24)1271.17
(18.89)Hangzhou 0.588 521.22
(38.76)727.12
(16.84)64.68
(10.52)0 29050.36
(30.05)8.89
(22.24)11728.30
(47.76)19593.96
(73.95)3580.35
(21.91)Ningbo 0.516 828.66
(55.78)680.92
(18.44)84.03
(16.30)0 30482.02
(33.24)9.21
(23.12)4434.92
(30.74)19569.51
(76.64)9626.74
(48.81)Jiaxing 0.447 399.46
(55.64)553.30
(24.94)105.66
(34.67)0 6749.44
(8.14)0 15194.43
(77.15)18987.06
(84.33)6181.34
(56.44)Huzhou 0.550 216.86
(50.76)0 37.39
(22.27)0 22092.02
(30.54)0 5971.13
(70.50)16000.27
(72.34)7746.85
(51.51)Shaoxing 0.415 1504.08
(80.60)427.50
(18.61)75.45
(24.90)0 30 897.68
(45.78)0 19899.69
(79.42)14944.61
(79.15)4098.40
(42.97)Jinhua 0.512 383.61
(57.04)26.15
(1.61)104.15
(37.08)0 11617.08
(14.13)0 2 454.57
(38.33)10250.95
(74.74)10776.87
(71.55)Zhoushan 1 0 0 0 0 0 0 0 0 0 Taizhou 0.614 246.85
(40.05)0 116.41
(34.51)0 38 194.28
(53.93)0 632.02
(12.33)4339.26
(42.94)2230.18
(25.39)Hefei 1 0 0 0 0 0 0 0 0 0 Chuzhou 0.426 134.45
(47.13)235.34
(17.21)109.83
(58.70)0 26 210.62
(38.97)0 802.53
(34.01)13485.68
(83.12)5779.70
(73.77)Maanshan 0.614 21.99
(11.51)0 11.66
(11.42)0 26297.37
(36.62)0 6 790.48
(78.95)34186.86
(91.02)65408.58
(95.68)Wuhu 0.585 41.53
(14.77)403.40
(21.78)31.70
(18.45)0 29683.77
(44.38)0 515.53
(14.42)36051.05
(91.70)23614.89
(87.18)Xuancheng 0.451 171.29
(56.78)77.84
(6.95)70.49
(52.14)0 22796.39
(33.15)0 405.58
(25.04)9858.37
(76.56)10440.01
(81.75)Tongling 1 0 0 0 0 0 0 0 0 0 Chizhou 1 0 0 0 0 0 0 0 0 0 Anqing 0.354 443.34
(73.17)193.28
(13.83)140.71
(62.59)0 40021.81
(68.64)0 953.08
(35.84)9479.14
(76.57)5145.02
(69.81)Note: Data in parentheses indicate the percentage (%) of the input-output adjustment and improvement potential of each index.
DMU: decision-making unit
下载: 导出CSV
-
[1] Bagheri B, Tousi S N, 2018. An explanation of urban sprawl phenomenon in Shiraz Metropolitan Area (SMA). Cities, 73: 71–90. doi: 10.1016/j.cities.2017.10.011 [2] Barbosa J A, Bragança L, Mateus R, 2015. Assessment of land use efficiency using Bsa tools: development of a new index. Journal of Urban Planning and Development, 141: 04014020. doi: 10.1061/(ASCE)UP.1943-5444.0000208 [3] Chen W, Ning S Y, Chen W J et al., 2020. Spatial-temporal characteristics of industrial land green efficiency in China: evidence from prefecture-level cities. Ecological Indicators, 113: 106256. doi: 10.1016/j.ecolind.2020.106256 [4] Chen Xiaohui, Guo Zijian, Zhong Rui, 2019. Reflections and prospect of interactions between development zones and urbanization: a case study of Jiangsu. Urban Planning Forum, (1): 68–73. (in Chinese) [5] Chen Y, Chen Z G, Xu G L et al., 2016. Built-up land efficiency in urban China: insights from the General Land Use Plan (2006–2020). Habitat International, 51: 31–38. doi: 10.1016/j.habitatint.2015.10.014 [6] De Vos J, Witlox F, 2013. Transportation policy as spatial planning tool; reducing urban sprawl by increasing travel costs and clustering infrastructure and public transportation. Journal of Transport Geography, 33: 117–125. doi: 10.1016/j.jtrangeo.2013.09.014 [7] Ding C R, Lichtenberg E, 2011. Land and urban economic growth in China. Journal of Regional Science, 51(2): 299–317. doi: 10.1111/j.1467-9787.2010.00686.x [8] Gao J L, Yuan F, 2017. Economic transition, firm dynamics, and restructuring of manufacturing spaces in urban China: empirical evidence from Nanjing. The Professional Geographer, 69(3): 504–519. doi: 10.1080/00330124.2016.1268059 [9] González M, López-Espín J J, Aparicio J et al., 2015. Using genetic algorithms for maximizing technical efficiency in data envelopment analysis. Procedia Computer Science, 51: 374–383. doi: 10.1016/j.procs.2015.05.257 [10] Guo S, Shen G Q, Chen Z M et al., 2014. Embodied cultivated land use in China 1987–2007. Ecological Indicators, 47: 198–209. doi: 10.1016/j.ecolind.2014.05.019 [11] He S W, Yu S, Li G D et al., 2020. Exploring the influence of urban form on land-use efficiency from a spatiotemporal heterogeneity perspective: evidence from 336 Chinese cities. Land Use Policy, 95: 104576. doi: 10.1016/j.landusepol.2020.104576 [12] Hegazy I R, Kaloop M R, 2015. Monitoring urban growth and land use change detection with GIS and remote sensing techniques in Daqahlia governorate Egypt. International Journal of Sustainable Built Environment, 4(1): 117–124. doi: 10.1016/j.ijsbe.2015.02.005 [13] Huang Muyi, Yue Wenze, He Xiang, 2018. Decoupling relationship between urban expansion and economic growth and its spatial heterogeneity in the Yangtze Economic Belt. Journal of Natural Resources, 33(2): 219–232. (in Chinese) [14] Huang Z J, He C F, Zhu S J, 2017. Do China’s economic development zones improve land use efficiency? The effects of selection, factor accumulation and agglomeration. Landscape and Urban Planning, 162: 145–156. doi: 10.1016/j.landurbplan.2017.02.008 [15] Jin G, Chen K, Wang P et al., 2019. Trade-offs in land-use competition and sustainable land development in the North China Plain. Technological Forecasting and Social Change, 141: 36–46. doi: 10.1016/j.techfore.2019.01.004 [16] Katkovnik V, Shmulevich I, 2002. Kernel density estimation with adaptive varying window size. Pattern Recognition Letters, 23(14): 1641–1648. doi: 10.1016/S0167-8655(02)00127-7 [17] Kaur H, Garg P, 2019. Urban sustainability assessment tools: a review. Journal of Cleaner Production, 210: 146–158. doi: 10.1016/j.jclepro.2018.11.009 [18] Kuang B, Lu X H, Zhou M et al., 2020. Provincial cultivated land use efficiency in China: empirical analysis based on the SBM-DEA model with carbon emissions considered. Technological Forecasting and Social Change, 151: 119874. doi: 10.1016/j.techfore.2019.119874 [19] Lee J H, Lim S, 2018. The selection of compact city policy instruments and their effects on energy consumption and greenhouse gas emissions in the transportation sector: the case of South Korea. Sustainable Cities and Society, 37: 116–124. doi: 10.1016/j.scs.2017.11.006 [20] Liu H W, Zhang Y, Zhu Q Y et al., 2017. Environmental efficiency of land transportation in China: a parallel slack-based measure for regional and temporal analysis. Journal of Cleaner Production, 142: 867–876. doi: 10.1016/j.jclepro.2016.09.048 [21] Liu S C, Xiao W, Li L L et al., 2020. Urban land use efficiency and improvement potential in China: a stochastic frontier analysis. Land Use Policy, 99: 105046. doi: 10.1016/j.landusepol.2020.105046 [22] Liu Y, Fan P L, Yue W Z et al., 2018. Impacts of land finance on urban sprawl in China: the case of Chongqing. Land Use Policy, 72: 420–432. doi: 10.1016/j.landusepol.2018.01.004 [23] Lu L L, Weng Q H, Guo H D et al., 2019. Assessment of urban environmental change using multi-source remote sensing time series (2000–2016): a comparative analysis in selected megacities in Eurasia. Science of the Total Environment, 684: 567–577. doi: 10.1016/j.scitotenv.2019.05.344 [24] Lu X H, Kuang B, Li J, 2018. Regional difference decomposition and policy implications of China’s urban land use efficiency under the environmental restriction. Habitat International, 77: 32–39. doi: 10.1016/j.habitatint.2017.11.016 [25] Luo J J, Xing X S, Wu Y Z et al., 2018. Spatio-temporal analysis on built-up land expansion and population growth in the Yangtze River Delta Region, China: from a coordination perspective. Applied Geography, 96: 98–108. doi: 10.1016/j.apgeog.2018.05.012 [26] Masoudi M, Tan P Y, Fadaei M, 2021. The effects of land use on spatial pattern of urban green spaces and their cooling ability. Urban Climate, 35: 100743. doi: 10.1016/j.uclim.2020.100743 [27] Miller J D, Brewer T, 2018. Refining flood estimation in urbanized catchments using landscape metrics. Landscape and Urban Planning, 175: 34–49. doi: 10.1016/j.landurbplan.2018.02.003 [28] Ministry of Housing and Urban-Rural Construction of China (MHURC), 2000–2018. China Urban Construction Statistical Yearbook. Beijing: China Planning Press. (in Chinese) [29] Mohajerani A, Bakaric J, Jeffrey-Bailey T, 2017. The urban heat island effect, its causes, and mitigation, with reference to the thermal properties of asphalt concrete. Journal of Environmental Management, 197: 522–538. doi: 10.1016/j.jenvman.2017.03.095 [30] Muscat A, De Olde E M, Candel J J L et al., 2022. The Promised Land: contrasting frames of marginal land in the European Union. Land Use Policy, 112: 105860. doi: 10.1016/j.landusepol.2021.105860 [31] National Bureau of Statistics of China (NBSC), 2000–2018. China City Statistical Yearbook 2000−2018. Beijing: China Statistics Press. (in Chinese) [32] National Bureau of Statistics of China (NBSC), 2019. China Statistical Yearbook 2019. Beijing: China Statistics Press. (in Chinese) [33] Otto S A C, Gernaat D E H J, Isaac M et al., 2015. Impact of fragmented emission reduction regimes on the energy market and on CO2 emissions related to land use: a case study with China and the European Union as first movers. Technological Forecasting and Social Change, 90: 220–229. doi: 10.1016/j.techfore.2014.01.015 [34] Sciara G C, 2020. Implementing regional smart growth without regional authority: the limits of information for nudging local land use. Cities, 103: 102661. doi: 10.1016/j.cities.2020.102661 [35] Tan M H, Li X B, Xie H et al., 2005. Urban land expansion and arable land loss in China—a case study of Beijing-Tianjin-Hebei region. Land Use Policy, 22(3): 187–196. doi: 10.1016/j.landusepol.2004.03.003 [36] Tone K, 2001. A slacks-based measure of efficiency in data envelopment analysis. European Journal of Operational Research, 130(3): 498–509. doi: 10.1016/S0377-2217(99)00407-5 [37] Wang Jianlin, Zhao Jiajia, Song Malin, 2017. Analysis of urban land use efficiency in China based on endogenous directional distance function model. Geographical Research, 36(7): 1386–1398. (in Chinese) [38] Wei Y D, Li H, Yue W Z, 2017. Urban land expansion and regional inequality in transitional China. Landscape and Urban Planning, 163: 17–31. doi: 10.1016/j.landurbplan.2017.02.019 [39] Williams T M, Ben-David M, Noren S et al., 2002. Running energetics of the North American river otter: do short legs necessarily reduce efficiency on land? Comparative Biochemistry and Physiology Part A:Molecular & Integrative Physiology, 133(2): 203–212. doi: 10.1016/S1095-6433(02)00136-8 [40] Xie Hualin, Wang Wei, 2015. Spatiotemporal differences and convergence of urban industrial land use efficiency for China’s major economic zones. Journal of Geographical Sciences, 25(10): 1183–1198. doi: 10.1007/s11442-015-1227-2 [41] Xu X Y, Yan Z, Xu S L, 2015. Estimating wind speed probability distribution by diffusion-based kernel density method. Electric Power Systems Research, 121: 28–37. doi: 10.1016/j.jpgr.2014.11.029 [42] Yang Liangjie, Wu Wei, Su Qin et al., 2013. Evaluation of road transport efficiency in China during 1997–2010 based on SBM-Undesirable model. Progress in Geography, 32(11): 1602–1611. (in Chinese) [43] Yang Qingke, Duan Xuanjun, Ye Lei et al., 2014. Efficiency evaluation of city land utilization in the Yangtze River Delta using a SBM-undesirable model. Resources Science, 36(4): 712–721. (in Chinese) [44] Yu J Q, Zhou K L, Yang S L, 2019. Land use efficiency and influencing factors of urban agglomerations in China. Land Use Policy, 88: 104143. doi: 10.1016/j.landusepol.2019.104143 [45] Yuan Peng, Tang Xin, Peng Wenwu et al., 2020. The spatial connection of potential innovation factor synergy and its relation with the upgrading of high-tech industry in Yangtze River Delta. Economic Geography, 40(6): 1–14. (in Chinese) [46] Zhao R, Liu S L, Liu Y Y et al., 2018a. A safety vulnerability assessment for chemical enterprises: a hybrid of a data envelopment analysis and fuzzy decision-making. Journal of Loss Prevention in the Process Industries, 56: 95–103. doi: 10.1016/j.jlp.2018.08.018 [47] Zhao Z, Bai Y P, Wang G F et al., 2018b. Land eco-efficiency for new-type urbanization in the Beijing-Tianjin-Hebei Region. Technological Forecasting and Social Change, 137: 19–26. doi: 10.1016/j.techfore.2018.09.031 [48] Zhu X H, Zhang P F, Wei Y G et al., 2019. Measuring the efficiency and driving factors of urban land use based on the DEA method and the PLS-SEM model—a case study of 35 large and medium-sized cities in China. Sustainable Cities and Society, 50: 101646. doi: 10.1016/j.scs.2019.101646 -

 点击查看大图

计量
- 文章访问数: 263
- HTML全文浏览量: 112
- PDF下载量: 16
- 被引次数: 0


