


-
Development is the eternal theme of human society, and human beings’ cognition of development mode have changed greatly along with the emergence and degradation of multiple environmental problems. Today, the current environmental footprint of humankind is not sustainable because of the earth’s limited natural resources and assimilation capacity (Hoekstra and Wiedmann, 2014). As the largest developing country, China plays a critical role in global environmental change. Although China has witnessed rapidly economic growth since 1978 (Brandt and Rawski, 2008; Storesletten and Zilibotti, 2014), this kind of development model that gave priority to economic development caused huge resource costs and environment problems (Vennemo et al., 2009; Bai et al., 2017; Liu et al., 2018). In 2002, China ranked 129th in the environmental sustainability evaluation ranking of 142 countries (Liu and Diamond, 2005).
To reconcile the contradiction between economic development and ecological environment, in 2007, the Seventeenth National Congress of the Communist Party of China officially proposed ‘ecological civilization construction’ for the first time and stressed that ecological civilization should be firmly established in the whole society, which raised the significance of protecting ecological environment to the height of ‘civilization’ (Feng, 2008). In 2012, the Eighteenth National Congress of the Communist Party of China further clarified the significance and prior role of ecological civilization construction and incorporated it into all aspects and the whole process of advancing economic, political, cultural, and social progress. Henceforward, green development, as the basic way to promote ecological civilization construction, has drawn growing attention from both academia and government agencies in China.
There are different definitions to green development (Liu et al., 2013; Li et al., 2014; Hu, 2017) and this concept is sometimes interchangeably used with another two concepts, green economy (UNEP, 2011) and green growth (OECD, 2011). These three concepts were proposed in a certain context as people began to reflect on the relation between humankind and nature. Human beings’ cognition of human-nature nexus is tortuous and many different views have emerged in different historical stages like environmental determinism, cultural determinism, harmony, etc. Nowadays, the view of harmony has been accepted worldwide. Essentially, green development, green economy and green growth are all a view of harmony which advocates that man and nature should live in harmony, and all of them can be considered as an explicit means to respond to support the initiative of sustainable development.
Green economy and green growth have gained momentum in both academia and policy-making areas at the global scale, but green growth is often interchangeably used with green economy, overlooking significant differences between green economy and green growth showed by statistical analysis (Merino-Saum et al., 2020). Indeed, the conceptual richness of both green economy and green growth as well as the conceptual blurriness between green economy and green growth progressively gathered attention across academic fields (Borel-Saladin and Turok, 2013; Smulders et al., 2014; Loiseau et al., 2016; D’Amato et al., 2017; Georgeson et al., 2017). Meanwhile, detailed methodological and empirical studies of green economy or green growth are prevalent as well (Pitkänen et al., 2016; Droste et al., 2016; Vukovic et al., 2019; Banerjee et al., 2020; Baniya et al., 2021). We found that the studies of green economy or green growth in Western countries mainly revolved around definitions differentiating, connotations interpreting, theories debating and cases investigating. But quantification of efforts made for pursuing green economy or green growth (for example, Acosta et al., 2019) were unsubstantially studied. Whereas, domestic scholars mainly focused on green development in the Chinese context and most studies assessed green development performance, by means of DEA (Feng et al., 2017; Che et al., 2018; Jin et al., 2019) and comprehensive indicator system (Wang et al., 2018; Cheng and Ge, 2020; Guo et al., 2021). However, green development performance quantification via the perspective of coupling coordination degree of regional ‘Economy-Ecology-Society’, which well fits in with the essence of green development, still needs to be probed into.
In this article, green development was defined as the cognition of geography to human-nature nexus under the background of the new era in China where people are facing the dual concerns of pursuing continued economic growth and promoting ecological civilization progress, and the essential meaning of green development is to pursue economic growth coordinated with environment protection, resources-saving, and human well-being improvement. Based on the definition, we developed a model with coupling coordination degree to quantify green development performance of Northeast China, a typical old industrial region that undertakes the mission of comprehensive revitalization. Ample natural resources, solid industry foundation, and geopolitical relations with the pre-Soviet prompted Northeast China to become the first industrialized region in the 1950s–1960s (Li and Shi, 1988; Zhang, 2008b). As China’s industrial cradle, Northeast China has made great contributions to China’s socialist economic construction at the cost of huge amounts of coal, oil, and timber. But its leading place faded since China’s transition to a market economy. In the 1990s, ‘the Northeast China Phenomenon’ mainly characterized by sluggish industrial development and poor economic benefits emerged (Li, 1996; Li and Li, 1996), which resulted in a series of social development issues. The central government issued the strategy of ‘Northeast China Revitalization’ in 2003. The strategy obtained notable achievements in the first stage, however, the economic growth in Northeast China started falling rapidly in 2013 (Fan et al., 2016). This sudden setback after a period of economic renaissance aroused great attention of the government and the society. Additionally, after decades of high-intensity resources exploitation, resources and environment carrying capacity of Northeast China has decreased sharply, so it is urgent for the region to adopt a sustainable way to promote economic transformation and social development while continuously improving overall ecological environment. This demand exactly fits in with the essence of green development, and it would behoove Northeast China to pursue green development for sustainability so as to break away from the predicament. Therefore, the human-nature nexus of Northeast China is a topic of theoretical and practical significance (Wu, 1991; Lu and Guo, 1998; Fan, 2008). Here we quantified the green development performance of Northeast China to track efforts towards ecological progress, also hoping for providing implications for sustainability of Northeast China and references for sustainability of other regions.
-
Northeast China (115°32′E–135°09′E, 38°42′N–53°35′N) includes the three provinces (Liaoning, Jilin and Heilongjiang), as well as the eastern part of the Inner Mongolia Autonomous Region (Hulun Buir, Hinggan, Chifeng, and Tongliao). In this study, we only focus on the three provinces since they are the core of Northeast China. Specifically, there are 14 cities in Liaoning, 8 cities and the Yanbian Korean Autonomous Prefecture in Jilin, and 12 cities and the Da Hinggan Ling Prefecture in Heilongjiang. The three provinces cover an area of approximately 8.08 ×10⁵ km2 and account for 8.4% of the land area of China. And the total population is about 98.25 million, accounting for 6.96% of the national population in 2020. The Yanbian Korean Autonomous Prefecture and the Da Hinggan Ling Prefecture are excluded from our study area in consideration of data shortage, so the 34 prefecture-level cities are our basic study objects (Fig. 1).

Figure 1. Location of Northeast China
-
Our study period was set from 2003 to 2019 due to statistical data limitations. All original annual data except PM2.5 were directly collected from the following authoritative sources: the China City Statistical Yearbook (National Bureau of Statistics of China, 2004–2020), the China Urban Construction Statistics (Ministry of Housing and Urban-Rural Development, 2004–2020), the Liaoning Statistical Yearbook (Bureau of Statistics of Liaoning, 2004–2020), the Jilin Statistical Yearbook (Bureau of Statistics of Jilin, 2004–2020) and the Heilongjiang Statistical Yearbook (Bureau of Statistics of Heilongjiang, 2004–2020). Some missing data in individual years were filled with the method of interpolation. PM2.5 concentration datasets were from the Washington University Atmospheric Compositional Analysis Group (
https://sites.wustl.edu/acag/datasets/surface-pm2-5/ ). -
Based on the definition of green development proposed above, we firstly constructed the green development performance indicator system which consists of three subsystems covering 15 indicators (Table 1) for Northeast China. These indicators were also referred to the government document (National Development and Reform Commission, 2016) under the premise of operability. Economic growth subsystem was selected to reflect economic growth strength and quality. Resources and environment status subsystem was selected to reflect the status of environmental pollution and resources-saving. Social progress subsystem was selected to reflect the improvements of people’s livelihood. The initial data were standardized to the range of 0 to 1 by the range standardized method. Next, the weight coefficient of each indicator was determined by the entropy method that calculate weight according to the strength of the relations between indicators or the amount of information provided by each indicator (Chen et al., 2009). And the performance of the three subsystems, namely Economic Growth Index (EGI), Resources and Environment Status Index (RESI), and Social Progress Index (SPI) were obtained by weight calculation. Then Green Development Performance Index (GDPI) was calculated by our green development performance quantification model that constructed with coupling coordination degree.
Table 1. Green development performance indicator system of Northeast China
System Subsystems Indicators Attribute Weight Green development performance indicator system of Northeast China Economic growth Per capita GDP Positive 0.278 GDP growth rate Positive 0.044 Proportion of the tertiary industry output value in GDP Positive 0.059 The optimization of the industrial structure Positive 0.178 Proportion of expenditure for science and technology in local general public budget expenditure Positive 0.440 Resources and environment status Industrial waste water discharge intensity Negative 0.040 Sulfur dioxide emission intensity Negative 0.137 Daily water consumption per capita Negative 0.042 GDP density Positive 0.587 PM2.5 Negative 0.195 Social progress Road surface area per capita Positive 0.373 Natural population growth rate Positive 0.077 Number of doctors per 10000 people Positive 0.293 Proportion of expenditure for education in local general public budget expenditure Positive 0.182 Green coverage rate of built district Positive 0.074 Coupling is a physics concept that has been widely applied to the field of social science. It refers to the phenomenon that two or more systems interact with each other and the coupling degree is used to measure the level of this interaction (Xing et al., 2019). But the coupling degree can not reflect the level of coordinated development among systems, the coupling coordination degree model is developed. The formula is as follows:
$$ C=3{\left[({U}_{1}\cdot {U}_{2}\cdot {U}_{3})/{\left({U}_{1}+{U}_{2}+{U}_{3}\right)}^{3}\right]}^{\frac{1}{3}} $$ (1) $$ T=a{U}_{1}+b{U}_{2}+c{U}_{3} $$ (2) $$ D=(C\cdot T{)}^{\frac{1}{2}} $$ (3) where U1, U2, and U3 represent EGI, RESI and SPI respectively in this article. C is the coupling degree among the three subsystems. T reflects the overall performance of the three subsystems. The coefficients a, b and c represent the contribution of EGI, RESI and SPI to T respectively. Here, we think the three subsystems are equally important, so a, b and c are equivalent, i.e., a=b=c=1/3. D is coupling coordination degree and it ranges from 0 to 1. And we get GDPI:
$$ GDPI=D=\sqrt{\left[(EGI+RESI+SPI)/3\right]\times \left(3{\left[(EGI\cdot RESI\cdot SPI)/{\left(EGI+RESI+SPI\right)}^{3}\right]}^{\frac{1}{3}}\right)} $$ (4) -
By Tobler’s First Law of Geography, ‘everything is related to everything else, but near things are more related than distant things’ (Tobler, 1970). Spatial autocorrelation describes the Law numerically: ‘Given a set S containing n geographical units, spatial autocorrelation refers to the relationship between some variable observed in each of the n localities and a measure of geographical proximity defined for all n (n – 1) pairs chosen from S’ (Getis, 2008). To explore the spatial characteristics of GDPI score, the method of spatial autocorrelation analysis was used in this study. Indices used to measure autocorrelation include global indicators of spatial autocorrelation and local indicators of spatial autocorrelation. The former is used to analyze the spatial dependence of the observations in the whole study area while the latter emphasizes the distribution characteristics of the observation in a locality within the study area. Moran’s I statistic, initially suggested by Moran (1948) and popularized through the classic work by Cliff and Ord (1973), is a commonly used indicator of global spatial autocorrelation. The equation of Moran’s I is as follow:
$$ {\rm{Moran}}{\text{'}}{\rm{s}}\;I=\sum _{i = 1}^{n}\sum _{j=1}^{n}{W}_{ij}\left({x}_{i}-\overline{x}\right)\left({x}_{j}- \overline{x}\right)/\sum _{i=1}^{n}{\left({x}_{i}- \overline{x}\right)}^{2}\sum _{i=1}^{n} \sum _{j=1}^{n}{W}_{ij} $$ (5) where xi and xj are GDPI scores of the city i and the city j respectively;
$\overline{x} $ is the average value of GDPI scores in the study area; n is the number of cities we studied; and Wij is the elements of the spatial weights matrix.Local indicators of spatial association (LISA) suggested by Anselin (1995) is usually used to map clusters, and it can be named as Local Moran’s I and its equation is as follow:
$$ \begin{split} {\rm{Local\;Moran}}{\mathrm{\text{'}}}{\rm{s}}\;I =& n\left({x}_{i}-\overline{x}\right)\sum\limits _{j=1}^{n}{W}_{ij}{\left({x}_{i} -\overline{x}\right)}^{2}/\\ &\sum\limits _{i=1}^{n}{\left({x}_{i}-\overline{x}\right)}^{2},\left(i \ne j\right) \end{split} $$ (6) where xi, xj,
$\overline{x} $ , n, and Wij share the same meaning with equation of Moran’s I. -
The coefficient of variation (CV) was used to measure the degree of regional disparities in GDPI score of Northeast China.
$$ CV=\left(1/\overline{h}\right)\sqrt{\sum\nolimits_{i=1}^{n}{{(h}_{i}-\overline{h})}^{2}/(n-1)} $$ (7) where n is the number of cities studied in Northeast China; hi is the GDPI score of the city i;
$\overline{h} $ is the average value of hi. The greater the coefficient of variation, the greater the disparities. -
According to our green development performance model, GDPI scores of the 34 cities in Northeast China were calculated yearly and we classified the results of each year into 6 levels based on the phenomenality of sorting (Li et al., 2014): 0.3–0.4 (Rather low), 0.4–0.5 (Quite low), 0.5–0.6 (Medium), 0.6–0.7 (Quite High) and 0.7–0.8 (Fairly high). The consistency of classification criteria in different years was guaranteed. Our results indicate that Northeast China has improved its GDPI score at the regional level over time (Fig. 2). Overall, GDPI score of Northeast China increased by about 19.64%, from a score of 0.443 in 2003 to 0.530 in 2019. Specifically, the score increased from 0.443 to 0.573 notably during 2003–2014, but decreased to 0.535 and trapped in anemic growth, stabilizing at around 0.533 during 2014–2019. Although the upward achievement was obvious before 2014, the poor performance followed up was also alarming. At the provincial level, GDPI scores of Liaoning, Jilin and Heilongjiang increased by about 18.71%, 23.15% and 18.4% respectively. The score of Heilongjiang ranked at the bottom of the three provinces during the whole study period.

Figure 2. Green development performance index (GDPI) scores of Liaoning, Jilin, Heilongjiang and Northeast China during 2003–2019
In general, the evolution of the proportion of cities classified by GDPI score in Northeast China during 2003–2019 proceeded roughly in three stages (Fig. 3). From 2003 to 2006, cities performed at the low level of GDPI score accounted for the majority of the 34 cities and there were no cities performed at the high level of GDPI score. In the second stage from 2007 to 2014, the proportion of cities scored below 0.5 descended significantly, and the proportion of cities performed at the high level of GDPI score ascended. However, in the third stage since 2015, the proportion of cities performed at the high level of GDPI score descended and cities performed at the medium level of GDPI score accounted for more than half of the 34 cities.

Figure 3. The proportion of cities classified by Green Development Performance Index (GDPI) score in Northeast China during 2003–2019
-
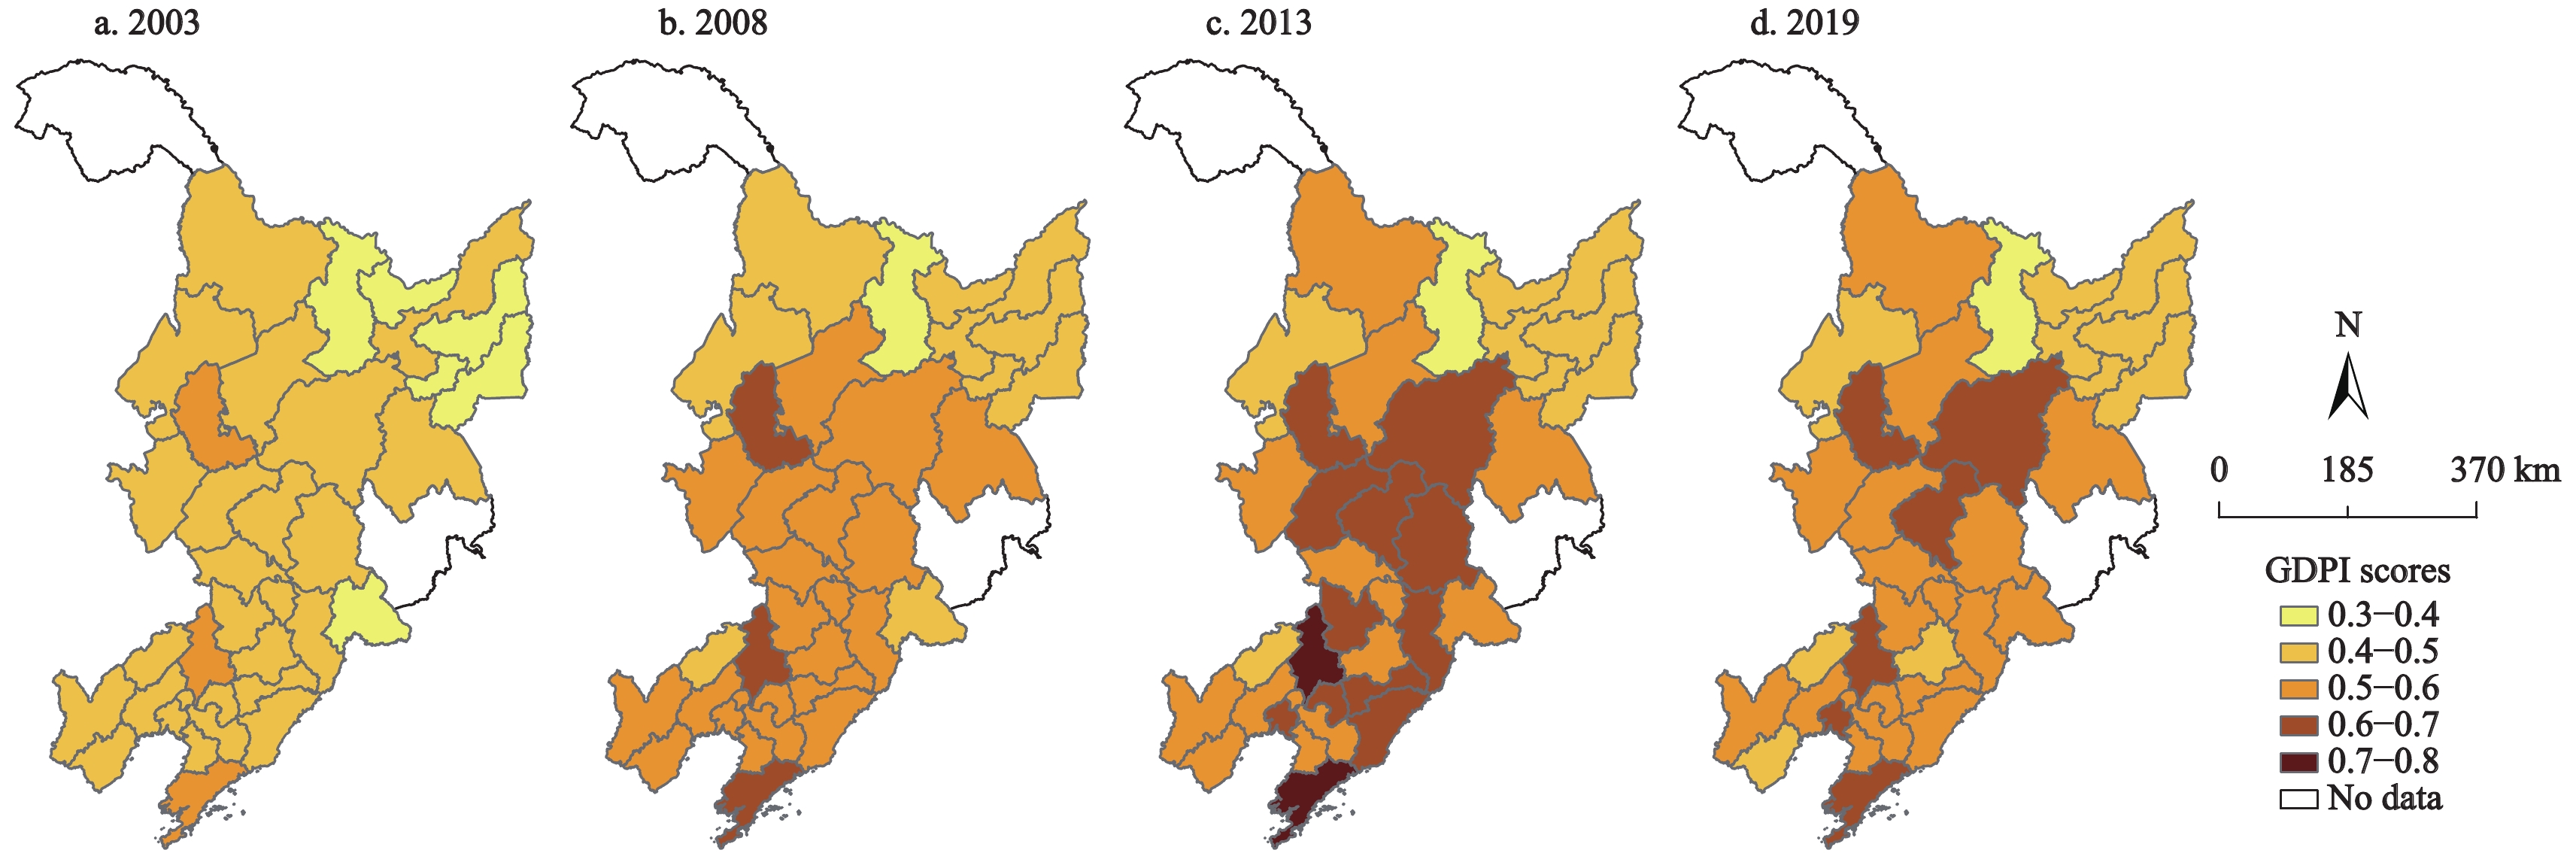
To explore spatial evolution characteristics of GDPI score, we selected 2003, 2008, 2013 and 2019 as the observation time points and conducted spatial visualization mapping of GDPI score in ArcGIS (Fig. 4). We found that GDPI scores of the 34 cities presented obvious spatial differentiation characteristics over time. On the whole, most cities have improved its green development performance during 2003–2019. The top five cities with rising GDPI score, in order of greatest to least rise, were Heihe, Yingkou, Dalian, Panjin and Songyuan. While the bottom five cities with rising GDPI score, in order of least to greatest rise, were Huluodao, Fushun, Suihua, Dandong and Qiqihar. The CV of GDPI score showed that the disparities of GDPI scores in Northeast China were enlarging over time, increasing from 0.095 in 2003 to 0.123 in 2019, with an increase of 29.5%. The disparities of GDPI scores in Heilongjiang were the most striking, followed by Liaoning and Jilin. In 2003, only three cities performed at the medium level of GDPI score, and they were Shenyang, Dalian and Daqing, in order of ranking. The rest cities all had a poor green development performance, especially the edge cities like Yichun, Baishan, etc. In 2008, the three cities that performed earlier at the medium level of GDPI score have further improved their green development performances and Dalian came first this time. And most cities performed at the medium level of GDPI score exclude Fuxin of Liaoning, Baishan of Jilin, and quite a few cities of Heilongjiang. In 2013, more cities have improved their green development performances like Harbin, Changchun, Tieling, Dandong, Yingkou, etc. Several high value zones of GDPI scores have formed and the polarization characteristics of GDPI scores among the 34 cities were visible. In 2019, the size of the high value zones shrank and the agglomeration effect seemed to disappear. Quite a few cities presented regressive performances of green development like Shenyang, Dalian, etc.

Figure 4. Spatial distribution of Green Development Performance Index (GDPI) scores in 2003, 2008, 2013 and 2019 for Northeast China

Figure 5. The clusters of Green Development Performance Index (GDPI) scores in 2003, 2008, 2013 and 2019 for Northeast China
To further explore the spatial distribution characteristics of GDPI score in Northeast China, the method of spatial autocorrelation was applied to this study. From a global perspective, Moran’s I, the global spatial autocorrelation index was calculated in GeoDa platform. And the significance test was carried out by the method of randomization of 999 permutations. The value of Moran’s I ranges from –1 to 1, and the closer it gets to 1, the stronger is the positive correlation, namely geographical units with similar properties are clustered. On the opposite, the closer it gets to –1, the stronger is the negative correlation namely geographical units with distinct properties are clustered. And zero value of Moran’s I means geographical units randomly scattered. As shown in Table 2, the value of Moran’s I was greater than 0 and the results passed the significance test with the specific confidence coefficient, indicating the cities with similar green development performance quantified by GDPI score were clustered in Northeast China so the spatial distribution pattern of GDPI score did appear to be significantly different than random. To reveal and map the specific clusters, we carried out the local spatial autocorrelation analysis. We can perceive from Fig. 5 that a majority of cities as shown in gray failed the significance test, which means they distribute randomly without significant spatial clustering phenomenon. High-High cluster means the city’s GDPI score was high and the GDPI scores of the cities around it were also high. The rest three clusters can be understood by the same manner. High-High clusters mainly located in central Liaoning and eastern Liaoning. Low-Low clusters mainly concentrated in the northeastern Heilongjiang. Low-High clusters were found in Songyuan, Benxi, Yingkou and Fushun, and the latter three cities located just next to the High-High clusters. High-Low cluster was found in Heihe. The latter two types of clusters were not stable compared to High-High clusters and Low-Low clusters during the study period. From a holistic view, it was obviously that there existed spatial clustering differentiation phenomenon of GDPI score in Northeast China from the north to the south.
Table 2. Moran’s I of GDPI scores during 2003–2019 for Northeast China
Year Moran’s I P-value z-score Confidence coefficient / % 2003 0.242 0.009 2.5380 95 2004 0.298 0.003 3.0969 99 2005 0.305 0.002 3.2251 99 2006 0.313 0.003 3.2535 99 2007 0.241 0.005 2.5661 95 2008 0.240 0.011 2.5489 95 2009 0.358 0.001 3.6225 99 2010 0.289 0.004 2.9281 99 2011 0.345 0.001 3.3645 99 2012 0.333 0.001 3.2646 99 2013 0.331 0.001 3.2410 99 2014 0.289 0.007 2.8780 99 2015 0.276 0.007 2.7573 99 2016 0.250 0.01 2.5559 95 2017 0.212 0.02 2.2264 95 2018 0.222 0.017 2.3154 95 2019 0.164 0.046 1.7880 90 -
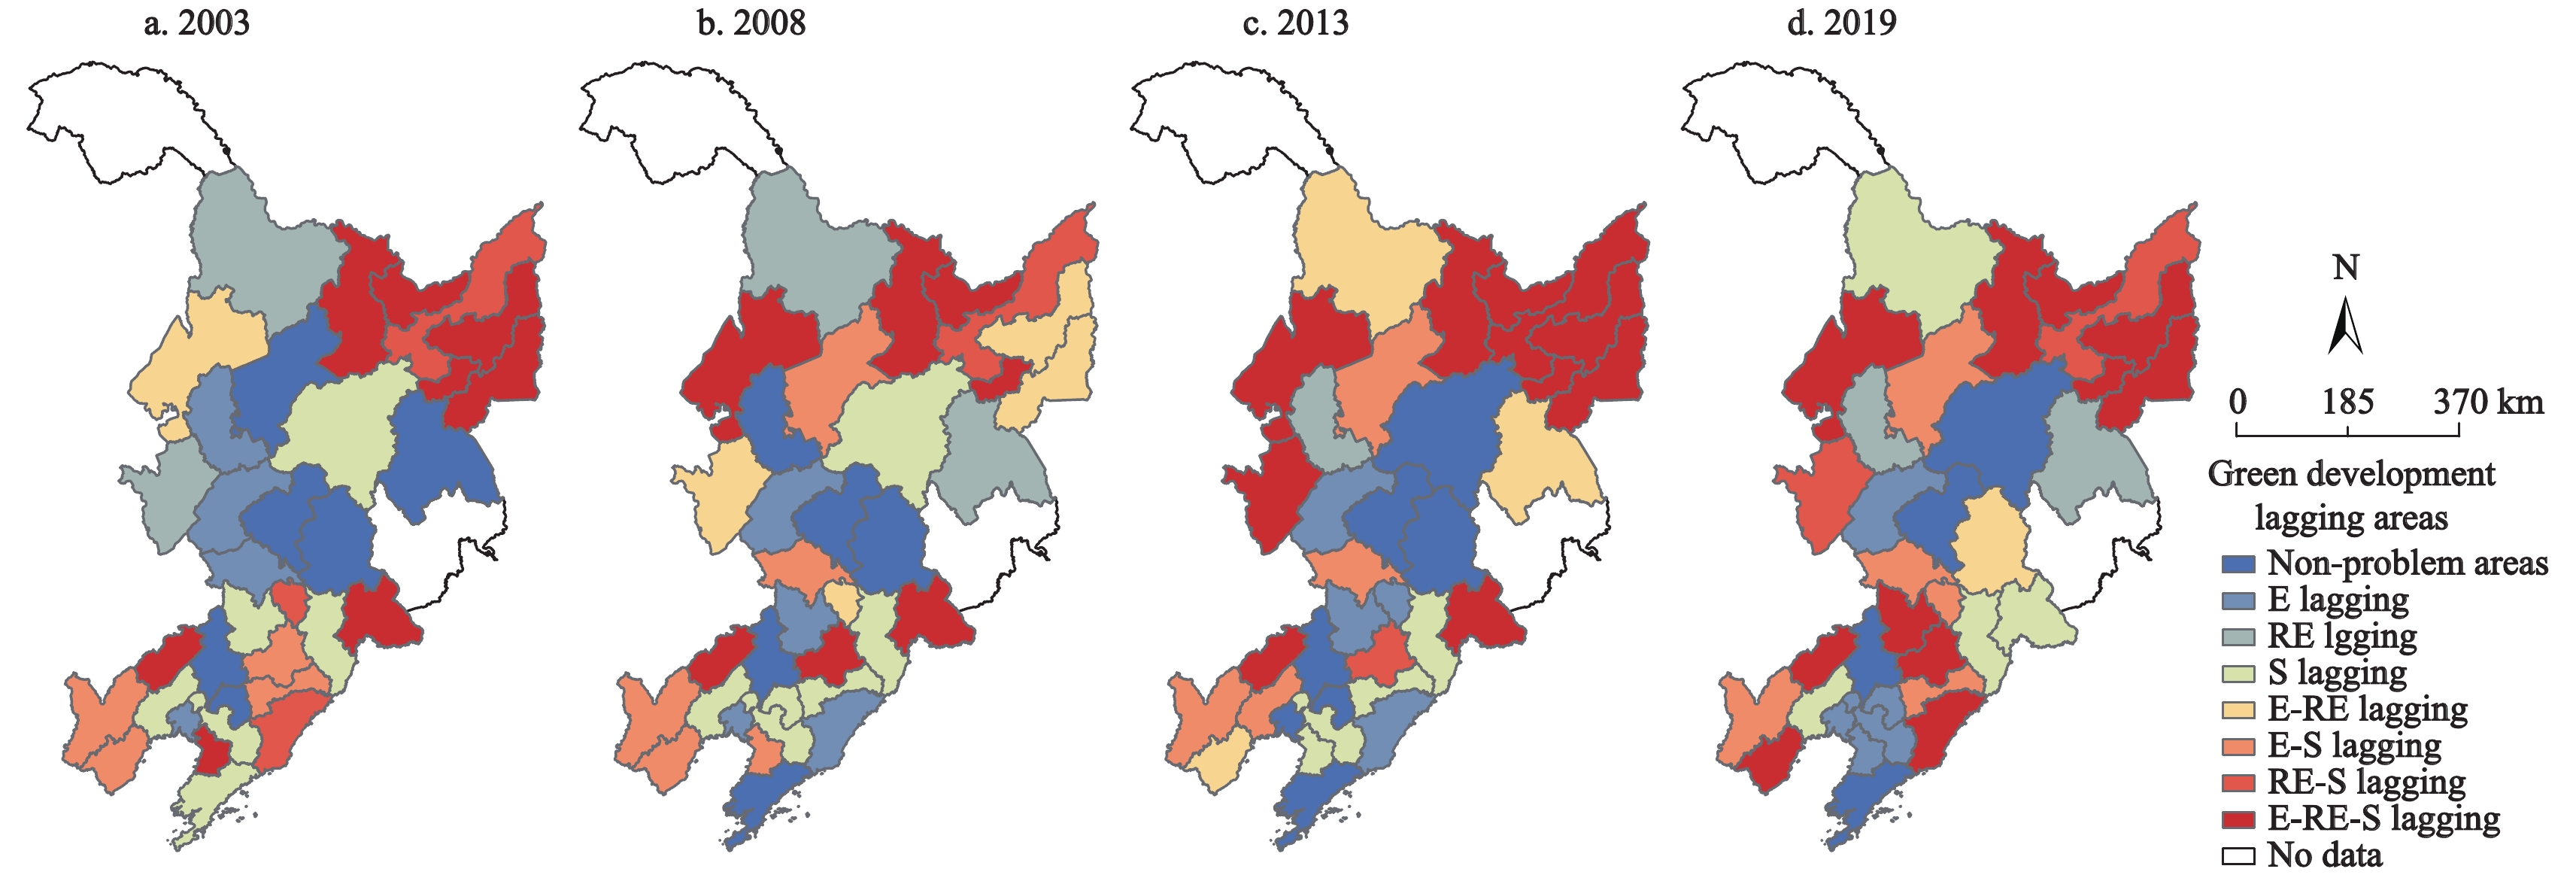
Economic growth subsystem, resources and environment status subsystem, and social progress subsystem of our green development performance indicator system are three basic subsystems which intertwined together. Spatial and temporal dynamics of GDPI score quantified by revealing the interior state among the three subsystems with the coupling coordination degree were explored above. But what performance of the three subsystems resulted in the specific green development performance of each city remained unclear. Therefore, we focused on the performance of the three subsystems so that we can identify green development lagging areas with different limitations of the three subsystems. The judgements criteria were established as follows. A city was defined as a development lagging area when meets one of the criteria: economic growth index score was lower than the average level; resources and environment status index score was lower than the average level; and social progress index score was lower than the average level. ArcGIS spatial query tool was used to extract the cities conformed to the above-mentioned three criteria. And the development lagging areas were specifically classified into seven basic types according to the performance of the three subsystems. E, RE, and S denote economic growth subsystem, resources and environment status subsystem, and social progress subsystem respectively, then the seven basic types were E lagging, RE lagging, S lagging, E-RE lagging, E-S lagging, RE-S lagging, E-RE-S lagging. Our results indicated that there were 28, 29, 27, and 30 development lagging areas in 2003, 2008, 2013, and 2019 respectively (Fig. 6), accounting for a considerable proportion. Among these problem areas, E-RE-S lagging type accounted for the biggest proportion and the number presented an increasing trend. These cities mainly located in the northeastern Heilongjiang and western Liaoning like Yichun, Hegang, Fuxin, etc. The number of non-problem areas or green development demonstration areas remained stable, and these cities were developed cities like Shenyang, Dalian, Changchun, Harbin, etc. The number of multifold systems lagging type increased from 16 in 2003 to 19 in 2019. Further, we found that five cities have deteriorated from non-problem type or onefold system lagging type to multifold systems lagging type, and they were Jilin, Tieling Suihua, Baicheng, Siping; only two cities have advanced from multifold systems lagging type to onefold system lagging type, and they were Baishan and Yingkou.

Figure 6. Spatial distribution of green development lagging areas in Northeast China in 2003, 2008, 2013 and 2019. E, RE, and S denote economic growth subsystem, resources and environment status subsystem, and social progress subsystem respectively
-
City is a complex system dominated by human beings, and its development is a culmination of multitude of feedback interactions formed by various social, economic, and environmental components (Güneralp and Seto, 2008). The benign coupling interaction evolution of these components is what the green development mode pursues. However, most relevant studies revolved around the three aspects of ‘Economy-Ecology-Society’ to give a relatively comprehensive assessment to green development performance, ignoring the balanced property of ‘Economy-Ecology-Society’ of green development. We tried to assess green development performance from the perspective of coupling coordination degree of the three subsystems, namely, economic growth, resources and environment status, and social progress. Our assessment approach was consistent with the connotation of green development proposed in this article.
Under the context of China’s ‘new normal’ that refers to a new situation that the Chinese economy has finally slowed down (Tung, 2016), GDPI score of Northeast was in accordance with GDP growth in a way, showing a downward trend since 2014 (Fan et al., 2016). The green development of a city is full of complexities as all elements within the city system are mutually connected by the existed exchanges of information, material and energy among them. And economy is a key to shape a city’s development as economic foundation determines superstructure. Significantly, Northeast China has been suffering from the influence of the past planned economy system and state-owned enterprises still play a key role in its economic development model, which result in the insufficient vitality of economic growth; besides, the lags behind in tertiary industrial leads to the insufficient impetus of economic development (Zhang et al., 2008a). These two issues were bound to weaken the regional economy competitiveness of Northeast China, thus directly affected the regional green development performance.
The observation that most cities in Heilongjiang were the ‘lowlands’ of GDPI score was well worth probing into. According to the government document ‘the plan for the Sustainable Development of Resource-based Cities in China (2013–2020)’ issued by the State Council (2013), these cities are all resource-based cities whose industries are heavily dependent on natural resources like coal, oil and forestry except for Jiamusi, Suihua, and Qiqihar. Yichun and Heihe are forestry-based cities while Qitaihe, Jixi, Shuangyashan and Hegang are coal-based cities. Because of the considerable reliance on natural resources endowments or in other words, the effect of what we call ‘resource curse’ (Auty, 2007), it is more arduous for these resource-based cities to accelerate the transformation of the mode of economic development and optimize the economic structure than other cities. Especially for cities like Yichun, Qitaihe, Shuangyashan and Hegang, since they are in the stage of recession and facing the severe problem of resources exhaustion. The GDPI scores of these cities were therefore affected. On the other hand, according to the major function zoning scheme (Fan et al., 2019) that frames four function zones namely urbanization zones, food security zones, ecological security zones and heritage protection zones, most districts of these resources-based cities are districted into the type of ecological security zones or food security zones. Their development status quo and prospects rest on this scheme that adopted and implemented by the Chinese central government to a large extent. As policies and projects drive land use changes (Dong et al., 2021), which affect the nexus of human and land. According to National Major Function Zoning (The State Council, 2010), the main functions of food security zones and key ecological zones are to provide agricultural products and ecological products respectively, so as to ensure the security of national agricultural products supply and the stability of the ecosystem. These regions are restricted to promote large-scale and high-intensity industrialization and urbanization.
So far, a key issue concerning equity emerges. Both equity and sustainability need to be understood as multi-dimensional and from diverse perspective, and they interact with each other in transformational pathways towards equitable sustainability (Leach et al., 2018). For resources-based cities in the ecological security zones, it is inequitable for them to pursue sustainability supported by the explicit means of green development as their industries of timber mining and manufacturing are restricted to develop in spite of the fact that they are forestry-based cities, and the example of Yichun well illustrate this point. Thus, the efforts that Yichun has made for green development were putting itself into a situation of stepping towards inequitable unsustainability. This issue of equity might be dealt properly with gross ecosystem product (GEP). GEP moves beyond conventional economic measures like gross domestic product (GDP) and it is a measure that summarizes the value of the contributions of nature to economic activity, and it is tractable with currently available data and methods (Ouyang et al., 2020). We can incorporate GEP indicator into the metrics of ecological performance. This idea remains to be explored in the future studies of green development performance assessment.
Actually, 19 cities are resource-based cities among the 34 cities we studied, and they belong to the four different stages according to their resources reserve and exploiting situation, namely growth stage, mature stage, recession stage and regeneration stage. Only Songyuan is in the stage of growth. Six cities are in the stage of mature, including Benxi, Jilin, Heihe, Daqing, Jixi and Mudanjiang. Eight cities are in the stage of recession, including Fuxin, Fushun, Liaoyuan, Baishan, Yichun, Hegang, Shuangyashan and Qitaihe. And four cities are in the stage of regeneration, including Anshan, Panjing, Huludao and Tonghua. Our research findings indicated that these cities were basically at the medium level or the low level of GDPI score, which were originally preconceived and also well understood. These resource-based cities still have serious problems left over from the era of planned economy, and transformational development is indeed tough for them. Worse still, most of these resources-cities are facing the severe challenge of population loss and natural population decline (Li et al., 2020; Ma et al., 2021), which certainly make it more difficult for them to progress towards green development.
We put forward the following green development suggestions for Northeast China. Considering the fact that Northeast China has not reached a high level of GDPI score, we think all the cities are very necessary to promote a high-quality development path rather than merely pursuing the quantity of economy. Under the background of ‘Revitalizing Northeast China’, this region has withstood a great deal of pressure from the central government and the local people. But the truth is that the revitalization strategy has achieved tangible achievements by now, and Northeast China has stepped out of the most difficult period. It is the right time to reform the government performance appraisal system that use GDP growth rate as the core of assessment, and a comprehensively evaluation system with multidimensional indicators is warranted. (Lu, 2014). GEP might be a reasonable choice to the green GDP appraisal system contributed to the comprehensively evaluation system. Moreover, regarding economic growth subsystem, the state-owned enterprise reform and the industrial structure upgrading are the two deep-rooted issues which require unflagging efforts. For resource-based cities, long-term policy supports from the central government are needed for their transformational development. Especially for forestry-based cities like Yichun, GEP can also provide the basis for determining financial compensation for the provision of ecosystem services since ‘lucid waters and lush mountains are invaluable assets’. Also, it is much pressing for themselves to actively seek a transformation pathway to green development, such as improving business environment, etc. For the four sub-provincial cities, Dalian, Shenyang, Changchun and Harbin, they are green development demonstration cities and they should play the leading role, promoting the program of metropolitan area strategy to drive surrounding cities within the metropolitan area vigorously, also effectively.
-
Green development is a new development philosophy for practicing the initiative of sustainable development. Our work provides an equilibrium perspective of ‘Economy-Ecology-Society’ for assessing regional green development performance to tract efforts made for ecological progress, or sustainability, grandly speaking. Overall, Northeast China has improved its green development performance, increasing by about 19.64% of GDPI score, but the later backwards trend was alarming. The disparities of GDPI scores in Northeast China were enlarging over time, and the disparities of GDPI scores in Heilongjiang were the most striking, followed by Liaoning and Jilin. From a global scale, Moran’s I confirmed the existence of positive spatial autocorrelation of GDPI scores in Northeast China. From a local scale, Local Moran’s I indicated that there existed stable Low-Low clusters in northeastern Heilongjiang and stable High-High clusters in central-eastern Liaoning. Based on the judgements criteria established, 28, 29, 27, and 30 development lagging areas in 2003, 2008, 2013, and 2019 were identified respectively, which provided references for city managers. and we found that some cities have deteriorated from non-problem type or onefold system lagging type to multifold systems lagging type, facing more complex issues of coupling development of ‘Economy-Ecology-Society’. This research suggests the need to track the spatio-temporal dynamics of green development performance towards SDGs in other regions and provides implications for sustainability of Northeast China and references for sustainability of other regions.
The limitation of this research should be acknowledged. Green development studies should consider regional differences. As implied above, there are obvious differences among the 19 resource-based cities. Also, the differences between the 19 resource-based cities and the rest 15 cities are palpable. The city level research of green development like case studies or comparative studies will deepen the green development theory and provide targeted guidelines for green development mode. Also, improved green development performance indicator system with detailed data such as GEP indicator of ecological performance are needed. These sheds light to the further study of green development.
-
We thank Prof Mark Wang from University of Melbourne for his support and encouragement to write this piece, and also for suggestions on earlier version of this article.
Green Development for Supporting Sustainability of Northeast China: Performance Quantification, Spatio-temporal Dynamics and Implications
-
Abstract: Green development is the cognition of geography to human-nature nexus under the background of the new era. As China is facing various eco-environment problems, green development has become a key approach towards ecological progress, and it is ultimately an explicit means to respond to support sustainable development in China. Quantifying green development performance is essential to track efforts towards sustainability and guide policymakers. However, applying the balanced property of ‘Economy-Ecology-Society’ of green development to its performance assessment is rarely discussed. Here we elaborated the connotation of green development and developed a quantification model with coupling coordination degree to assess green development performance of the largest old industrial base of China, Northeast China. We found that the green development performance has been improved from a score of 0.443 in 2003 to 0.530 in 2019 but the disparities of green development performance were enlarging over time, especially for the cities in Heilongjiang. A positive spatial autocorrelation phenomenon of green development performance was confirmed, and Low-Low clusters in the northeastern Heilongjiang and High-High clusters in the central-eastern Liaoning were discovered. This study suggests the need to track the spatio-temporal dynamics of green development performance to provide references for achieving sustainable development goals in northeast China and other regions.
-
Figure 2. Green development performance index (GDPI) scores of Liaoning, Jilin, Heilongjiang and Northeast China during 2003–2019
Figure 3. The proportion of cities classified by Green Development Performance Index (GDPI) score in Northeast China during 2003–2019
Figure 4. Spatial distribution of Green Development Performance Index (GDPI) scores in 2003, 2008, 2013 and 2019 for Northeast China
Figure 5. The clusters of Green Development Performance Index (GDPI) scores in 2003, 2008, 2013 and 2019 for Northeast China
Figure 6. Spatial distribution of green development lagging areas in Northeast China in 2003, 2008, 2013 and 2019. E, RE, and S denote economic growth subsystem, resources and environment status subsystem, and social progress subsystem respectively
Table 1. Green development performance indicator system of Northeast China
System Subsystems Indicators Attribute Weight Green development performance indicator system of Northeast China Economic growth Per capita GDP Positive 0.278 GDP growth rate Positive 0.044 Proportion of the tertiary industry output value in GDP Positive 0.059 The optimization of the industrial structure Positive 0.178 Proportion of expenditure for science and technology in local general public budget expenditure Positive 0.440 Resources and environment status Industrial waste water discharge intensity Negative 0.040 Sulfur dioxide emission intensity Negative 0.137 Daily water consumption per capita Negative 0.042 GDP density Positive 0.587 PM2.5 Negative 0.195 Social progress Road surface area per capita Positive 0.373 Natural population growth rate Positive 0.077 Number of doctors per 10000 people Positive 0.293 Proportion of expenditure for education in local general public budget expenditure Positive 0.182 Green coverage rate of built district Positive 0.074  下载: 导出CSV
Table 2. Moran’s I of GDPI scores during 2003–2019 for Northeast China
Year Moran’s I P-value z-score Confidence coefficient / % 2003 0.242 0.009 2.5380 95 2004 0.298 0.003 3.0969 99 2005 0.305 0.002 3.2251 99 2006 0.313 0.003 3.2535 99 2007 0.241 0.005 2.5661 95 2008 0.240 0.011 2.5489 95 2009 0.358 0.001 3.6225 99 2010 0.289 0.004 2.9281 99 2011 0.345 0.001 3.3645 99 2012 0.333 0.001 3.2646 99 2013 0.331 0.001 3.2410 99 2014 0.289 0.007 2.8780 99 2015 0.276 0.007 2.7573 99 2016 0.250 0.01 2.5559 95 2017 0.212 0.02 2.2264 95 2018 0.222 0.017 2.3154 95 2019 0.164 0.046 1.7880 90
下载: 导出CSV
-
[1] Acosta L A, Maharjan P, Peyriere H et al. , 2019. Green Growth Index: Concept, Methods and Applications. GGGI Technical Report No. 5, Green Growth Performance Measurement (GGPM) Program. Seoul: Global Green Growth Institute. [2] Anselin L, 1995. Local indicators of spatial association—LISA. Geographical Analysis, 27(2): 93–115. doi: 10.1111/j.1538-4632.1995.tb00338.x [3] Auty R M, 2007. Natural resources, capital accumulation and the resource curse. Ecological Economics, 61(4): 627–634. doi: 10.1016/j.ecolecon.2006.09.006 [4] Bai X M, McPhearson T, Cleugh H et al., 2017. Linking urbanization and the environment: conceptual and empirical advances. Annual Review of Environment and Resources, 42(1): 215–240. doi: 10.1146/annurev-environ-102016-061128 [5] Banerjee O, Bagstad K J, Cicowiez M et al., 2020. Economic, land use, and ecosystem services impacts of Rwanda’s Green Growth Strategy: an application of the IEEM+ESM platform. Science of the Total Environment, 729: 138779. doi: 10.1016/j.scitotenv.2020.138779 [6] Baniya B, Giurco D, Kelly S, 2021. Green growth in Nepal and Bangladesh: empirical analysis and future prospects. Energy Policy, 149: 112049. doi: 10.1016/j.enpol.2020.112049 [7] Borel-Saladin J M, Turok I N, 2013. The green economy: incremental change or transformation. Environmental Policy and Governance, 23(4): 209–220. doi: 10.1002/eet.1614 [8] Brandt L, Rawski T G, 2008. China’s Great Economic Transformation. Cambridge: Cambridge University Press, 1–26. doi: 10.1017/cbo9780511754234.002 [9] Bureau of Statistics of Heilongjiang, 2004–2020. Heilongjiang Statistical Yearbook 2004–2019. Beijing: China Statistics Press. (in Chinese) [10] Bureau of Statistics of Jilin, 2004–2020. Jilin Statistical Yearbook 2004–2019. Beijing: China Statistics Press. (in Chinese) [11] Bureau of Statistics of Liaoning, 2004–2020. Liaoning Statistical Yearbook 2004–2019. Beijing: China Statistics Press. (in Chinese) [12] Che Lei, Bai Yongping, Zhou Liang et al., 2018. Spatial pattern and spillover effects of green development efficiency in China. Scientia Geographica Sinica, 38(11): 1788–1798. (in Chinese) [13] Cheng C Y, Ge C Z, 2020. Green development assessment for countries along the belt and road. Journal of Environmental Management, 263: 110344. doi: 10.1016/j.jenvman.2020.110344 [14] Chen Mingxing, Lu Dadao, Zhang Hua, 2009. Comprehensive evaluation and the driving factors of China’s urbanization. Acta Geographica Sinica, 64(4): 387–398. (in Chinese) [15] Cliff A C, Ord J K, 1973. Spatial Autocorrelation. London: Pion Limited. [16] D’Amato D, Droste N, Allen B et al., 2017. Green, circular, bio economy: A comparative analysis of sustainability avenues. Journal of Cleaner Production, 168: 716–734. doi: 10.1016/j.jclepro.2017.09.053 [17] Dong Yulin, Ren Zhibin, Fu Yao et al., 2021. Land use/cover change and its policy implications in typical agriculture-forest ecotone of central Jilin Province, China. Chinese Geographical Science, 31(2): 261–275. doi: 10.1007/s11769-021-1189-5 [18] Droste N, Hansjürgens B, Kuikman P et al., 2016. Steering innovations towards a green economy: understanding government intervention. Journal of Cleaner Production, 135: 426–434. doi: 10.1016/j.jclepro.2016.06.123 [19] Fan Jie, 2008. Academic thinking and economic geography of the ‘regional system of man-land relationship’. Economic Geography, 28(2): 177–183. (in Chinese) [20] Fan Jie, Liu Hanchu, Wang Yafei et al., 2016. ‘The Northeast China phenomenon’ and prejudgment on economic revitalization in Northeast China: a primary research on stable factors to impact national spatial development and protection pattern. Scientia Geographica Sinica, 36(10): 1445–1456. (in Chinese) [21] Fan J, Wang Y F, Wang, C S et al., 2019. Reshaping the sustainable geographical pattern: A major function zoning model and its applications in China. Earth’s Future, 7: 25–42. doi: 10.1029/2018EF00107 [22] Feng C, Wang M, Liu G C et al., 2017. Green development performance and its influencing factors: a global perspective. Journal of Cleaner Production, 144: 323–333. doi: 10.1016/j.jclepro.2017.01.005 [23] Feng Zhijun, 2008. Scientific development and conservation culture. China Soft Science, (8): 1–10. (in Chinese) [24] Georgeson L, Maslin M, Poessinouw M, 2017. The global green economy: a review of concepts, definitions, measurement methodologies and their interactions. Geography and Environment, 4(1): e00036. doi: 10.1002/geo2.36 [25] Getis A, 2008. A history of the concept of spatial autocorrelation: a geographer’s perspective. Geographical Analysis, 40(3): 297–309. doi: 10.1111/j.1538-4632.2008.00727.x [26] Güneralp B, Seto K C, 2008. Environmental impacts of urban growth from an integrated dynamic perspective: a case study of Shenzhen, South China. Global Environmental Change, 18(4): 720–735. doi: 10.1016/j.gloenvcha.2008.07.004 [27] Guo Fuyou, Tong Lianjun, Qiu Fangdao et al., 2021. Spatio-temporal differentiation characteristics and influencing factors of green development in the eco-economic corridor of the Yellow River Basin. Acta Geographica Sinica, 76(3): 726–739. (in Chinese) [28] Hoekstra A Y, Wiedmann T O, 2014. Humanity’s unsustainable environmental footprint. Science, 344(6188): 1114–1117. doi: 10.1126/science.1248365 [29] Hu A G, 2017. China: Innovative Green Development. 2nd ed. Singapore: Springer. [30] Jin P Z, Peng C, Song M L, 2019. Macroeconomic uncertainty, high-level innovation, and urban green development performance in China. China Economic Review, 55: 1–18. doi: 10.1016/j.chieco.2019.02.008 [31] Leach M, Reyers B, Bai X M et al., 2018. Equity and sustainability in the Anthropocene: a social–ecological systems perspective on their intertwined futures. Global Sustainability, 1: e13. doi: 10.1017/sus.2018.12 [32] Li Chenggu, 1996. A study on the mechanism of recession and structure transformation of Northeast old industrial base. Scientia Geographica Sinica, 16(2): 106–114. (in Chinese) [33] Li Chenggu, Li Zhenquan, 1996. Feature of ‘Northeast Phenomenon’ and causing factor. Economic Geography, 16(1): 34–38. (in Chinese) [34] Li He, Lo Kevin, Zhang Pingyu, 2020. Population Shrinkage in Resource-dependent Cities in China: Processes, Patterns and Drivers. Chinese Geographical Science, 30(1): 1–15. doi: 10.1007/s11769-019-1077-4 [35] Li Xiaoxi, Liu Yimeng, Song Tao, 2014. Calculation of the green development index. Social Sciences in China, (6): 69–95. (in Chinese) [36] Li Zhenquan, Shi Qingwu, 1988. A General Survey of Economic Geography in Northeast Economic Zone. Changchun: Northeast Normal University Press. (in Chinese) [37] Liu J G, Diamond J, 2005. China’s environment in a globalizing world. Nature, 435(7046): 1179–1186. doi: 10.1038/4351179a [38] Liu J G, Viña A, Yang W et al., 2018. China’s environment on a metacoupled planet. Annual Review of Environment and Resources, 43(1): 1–34. doi: 10.1146/annurev-environ-102017-030040 [39] Liu Jiyuan, Deng Xiangzheng, Liu Weidong et al., 2013. Conceptual framework of green development in Western China. China Population Resources and Environment, 23(10): 1–7. (in Chinese) [40] Loiseau E, Saikku L, Antikainen R et al., 2016. Green economy and related concepts: an overview. Journal of Cleaner Production, 139: 361–371. doi: 10.1016/j.jclepro.2016.08.024 [41] Lu Dadao, Guo Laixi, 1998. Man earth areal system, the core of geographical study, on the geographical thoughts and academic contributions of academician Wu Chuanjun. Acta Geographica Sinica, 53(2): 97–105. (in Chinese) [42] Lu Disheng, 2014. Low carbon governance in China: barriers and solutions. Scientia Geographica Sinica, 34(3): 265–271. (in Chinese) [43] Ma Zuopeng, Li Chenggu, Zhang Pingyu, 2021. Characteristics, mechanism and response of urban shrinkage in the three provinces of Northeast China. Acta Geographica Sinica, 76(4): 767–780. (in Chinese) [44] Merino-Saum A, Clement J, Wyss R et al., 2020. Unpacking the Green Economy concept: a quantitative analysis of 140 definitions. Journal of Cleaner Production, 242: 118339. doi: 10.1016/j.jclepro.2019.118339 [45] Ministry of Housing and Urban-Rural Development, PRC, 2004–2019. China Urban Construction Statistical Yearbook 2004–2020, Beijing: China Statistics Press. (in Chinese) [46] Moran P A P, 1948. The interpretation of statistical maps. Journal of the Royal Statistical Society:Series B (Methodological), 10(2): 243–251. doi: 10.1111/j.2517-6161.1948.tb00012.x [47] National Bureau of Statistics of China, 2004–2020. China City Statistical Yearbook 2004–2019, Beijing: China Statistics Press. (in Chinese) [48] National Development and Reform Commission, 2016. Notice on Printing and Distributing the ‘Green Development Indicator System’ and ‘Ecological Civilization Construction Assessment Objective System’. Available at: https://www.ndrc.gov.cn/fggz/hjyzy/stwmjs/201612/t20161222_1161174.html?code=&state=123. Cited 10 March 2021. (in Chinese) [49] OECD (Organization for Economic Co-operation and Development), 2011. Towards Green Growth. https://www.oecd.org/greengrowth/towards-green-growth-9789264111318-en.htm. Cited 1 March 2021. [50] Ouyang Z Y, Song C S, Zheng H et al., 2020. Using gross ecosystem product (GEP) to value nature in decision making. Proceedings of the National Academy of Sciences of the United States of America, 117(25): 14593–14601. doi: 10.1073/pnas.1911439117 [51] Pitkänen K, Antikainen R, Droste N et al., 2016. What can be learned from practical cases of green economy?–Studies from five European countries. Journal of Cleaner Production, 139: 666–676. doi: 10.1016/j.jclepro.2016.08.071 [52] Smulders S, Toman M, Withagen C, 2014. Growth Theory and ‘green growth’. Oxford Review of Economic Policy, 30(3): 423–446. doi: 10.1093/oxrep/gru027 [53] Storesletten K, Zilibotti F, 2014. China’s great convergence and beyond. Annual Review of Economics, 6(1): 333–362. doi: 10.1146/annurev-economics-080213-041050 [54] The State Council, 2010. Circular of the state council on printing and distributing the national plan for main function zones. http://www.gov.cn/zhengce/content/2011-06/08/content_1441.htm. Cited 22 March 2021. (in Chinese) [55] The State Council, 2013. Circular of the state council on the issuance of the national sustainable development plan for resource-based cities (2013−2020). http://www.gov.cn/gongbao/content/2013/content_2547140.htm. Cited 22 March 2021. (in Chinese) [56] Tobler W R, 1970. A computer movie simulating urban growth in the detroit region. Economic Geography, 46(S1): 234–240. doi: 10.2307/143141 [57] Tung R L, 2016. Opportunities and challenges ahead of China’s ‘new normal’. Long Range Plan, 49: 632–640. doi: 10.1016/j.lrp.2016.05.001 [58] UNEP(United Nations Environment Programme), 2011. Towards a green economy: pathways to sustainable development and poverty eradication. https://sustainabledevelopment.un.org/index.php?menu=35&nr=126&page=view&type=400. Cited 1 March 2021. [59] Vennemo H, Aunan K, Lindhjem H et al., 2009. Environmental pollution in China: status and trends. Review of Environmental Economics and Policy, 3(2): 209–230. doi: 10.1093/reep/rep009 [60] Vukovic N, Pobedinsky V, Mityagin S et al., 2019. A study on green economy indicators and modeling: russian context. Sustainability, 11(17): 4629. doi: 10.3390/su11174629 [61] Wang M X, Zhao H H, Cui J X et al., 2018. Evaluating green development level of nine cities within the Pearl River Delta, China. Journal of Cleaner Production, 174: 315–323. doi: 10.1016/j.jclepro.2017.10.328 [62] Wu Chuanjun., 1991. The core of geographical study: man-earth areal system. Economic Geography, 11(3): 1–6. (in Chinese) [63] Xing L, Xue M G, Hu M S, 2019. Dynamic simulation and assessment of the coupling coordination degree of the economy–resource–environment system: case of Wuhan City in China. Journal of Environmental Management, 230: 474–487. doi: 10.1016/j.jenvman.2018.09.065 [64] Zhang Pingyu, 2008a. Northeast Regional Development Report 2008. Beijing: Science Press. (in Chinese) [65] Zhang Pingyu, 2008b. Revitalizing old industrial base of Northeast China: process, policy and challenge. Chinese Geographical Science, 18(2): 109–118. doi: 10.1007/s11769-008-0109-2 -

 点击查看大图

计量
- 文章访问数: 354
- HTML全文浏览量: 178
- PDF下载量: 45
- 被引次数: 0


