


-
Driven by the development of economy and agglomeration of the population, urbanization process has been boosting in the past two centuries. As the urbanization occurs pervasively, more attention was drawn to it. However, the other side of urbanization, that is, the decline of the urban economy and the loss of population can be overlooked occasionally (Rieniets, 2009). In fact, as early as the late 20th century, affected by deindustrialization, suburbanization, aging, and social structure transformation, some cities experienced the phenomenon of ‘urban shrinkage’ caused by population loss and economic recession (Wu and Sun, 2017). There is a type of these cities, namely, resource-based city which refers to a city built or developed by relying on resource and taking resource exploitation and processing as the leading industry (Miao et al., 2018). Due to long-term dependence on the mineral resources, resource-based cities have more inclination to shrink because of the slowdown of economic growth, single industry structure and the ‘boom and bust’ industry cycle (He et al., 2017; Yang and Jiang, 2018).
With the acceleration of urbanization and globalization worldwide, urban shrinkage is no longer a rare phenomenon (Bontje, 2001; Camarda et al., 2015; Sousa and Pinho, 2015; Hartt, 2018b). Shrinking cities are generally characterized by population loss, economic downtown, a decline in employment (Feldhoff, 2013; Du et al., 2020a). In addition to the conventional population and economic, industrial restructuring caused by globalization, is also considered as important factor that contribute to urban shrinkage (Xu and Pang, 2014; Wu and Yao, 2021). Besides, functional impairment, an increasing number of vacant, abandoned buildings and the decrease of public facilities all can be classified in the important factors of urban shrinkage. Scholars have summarized the causes of urban shrinkage as follows: population and economic factors, industrial restructuring caused by globalization, declination of urban facilities (Bontje, 2004; Blanco et al., 2009; Reckien and Martinez-Fernandez, 2011; Wiechmann and Pallagst, 2012; Alves et al., 2016). Although urban shrinkage is mostly manifested in population loss and economic recession, more and more studies have confirmed the heterogeneity of the driving mechanism of urban shrinkage (Haase et al., 2014). Based on different shrinkage tracks due to the specific background and characteristics of the city, the reasons of urban shrinkage vary from one another. Besides, causes affecting urban shrinkage rarely have an effect on their own but work in combination with other factors. Because of the cyclic causality among the factors in the process of urban shrinkage, the results may, in turn, become the driving factors (Khavarian-Garmsir et al., 2018). As an important part of shrinking cities, resource-based shrinking cities often show similar characteristics because of the depletion of resources (Meng et al., 2019). With the continuous resource exploitation, the phenomenon of ‘mine exhaustion and city decline’ is more likely to occur (Li and Zou, 2018). Once urban shrinkage occurs in resource-based cities, its degree of shrinkage will be more serious and bring many negative effects (Wang et al., 2019). Early studies tend to believed that urban shrinkage was affected by specific factors similar to linear causal mechanism. However, more and more studies have confirmed that it is necessary not only to explore how urban shrinkage occurs, but also to investigate its mechanism as a process. In order to grasp the nonlinear interdependence between the variables related to urban shrinkage, it is necessary to perform empirical research to explore the dynamic process of urban shrinkage. Nevertheless, few studies have attempted to reveal interdependent relationships amongst variables related to shrinkage using quantitative methods. Initially, Gatzweiler et al. (2003) tested the circular relationship of shrinking cities in Germany by calculating the correlation coefficients of six economic and demographic indicators. Furthermore, Hoekveld (2012) applied the cross-correlation analysis of time series data method to conduct an empirical study on the cyclical causality of the shrinking region of the Netherlands by selecting demographic factors and economic factors. Following Hoekveld’s work, Hartt (2018a) expanded the variables and integrated complex network analysis and visualization methods based on the cross-correlation analysis of time series data method to explore the causal cycle of urban shrinkage in Canada. However, relying on cross-correlation analysis solely may lead to false correlations between the two variables (Billings, 2013). That is, two variables are not correlated, but due to the existence of a third variable, the analysis results of the two variables show correlation.
As early as 2010, UN Habitat identified approximately 50 shrinking cities in China in its world city report. Urban shrinkage is one of the challenges that China’s new-type urbanization will face in the future, which has been attracting extensive attention of scholars (Long and Wu, 2016; Yang and Dunford, 2018; Li and Mykhnenko, 2018). In 2019, the National Development and Reform Commission document on key tasks of new urbanization construction first emphasized the issue of medium and small sized shrinking cities. However, research on shrinking cities in China is still in the exploratory stage, and there is little prior knowledge in terms of complex mechanism of urban shrinkage. At present, related research covered from identification on shrinking cities in China to the introduction on the case of western shrinking cities (Huang, 2014; Long et al., 2015; Wu et al., 2015; Zhang and Guo, 2016; Gao and Long, 2017). There are also studies that focus on the influencing factors of urban shrinkage, mostly through the method of regression analysis (Lin et al., 2017; Du and Li, 2018). But the regression analysis can hardly reveal the circular feedback relationship between the influencing factors of urban shrinkage. Especially, scholars have noticed the shrinkage of towns in specific areas (Wu et al., 2015; Zhou et al., 2017). Besides, in some urban areas of China, spatial expansion and local shrinkage coexist (Yang et al., 2015; Wu and Wang, 2020). The research on China’s resource-based cities mainly focuse on the key issues in the development and transformation of resource-based cities (Yu et al., 2016; Li and Dewan, 2017; Shao et al., 2020), evaluating the transformation performance of resource-based cities (Sun et al., 2012; Yu et al., 2013; Xie et al., 2017), and the industrial transformation of resource-based cities (Jin et al., 2010; Long et al., 2013; Jiang et al., 2020). Although literatures have paid attention to the problem of resource-based shrinking cities in China, it is mainly reflected in policy research and qualitative analysis ( Gao and Long, 2017; He et al., 2017). However, few literatures use empirical methods to study the causal feedback of urban shrinkage, especially regarding resource-based shrinking cities. Nevertheless, as a representative resource-based city, the population loss of Hegang is serious and the urban shrinkage of it is significant. Based on Hartt’s research (Hartt, 2018a), this paper extends the existing literature by distinguishing the development tracks of Hegang and exploring the course of the shrinkage process by introducing partial-correlation analysis to exclude false correlations between the two variables.
In summary, first and foremost, the trajectory of urban shrinkage is very complex, and there are still improvements to be made in the existing empirical methods to study the evolution mechanism of urban shrinkage. Second, existing case studies are more focused on Western economies, and the analysis of shrinking cities in rapidly developing countries such as China has yet to catch up. Third, resource-based cities are more prone to shrinkage due to their characteristics of economic development. Few researches have conducted empirical analysis on the evolution mechanism of resource-based shrinking cities in China. This paper employs a method involving the cross-correlation, partial-correlation, complex network analysis and explores the causal feedback of Chinese resource-based shrinking city, Hegang. Our research adds to the knowledge of urban shrinkage with evidence from the stronger statistical. It advances our understanding of the dynamic process of urban shrinkage. Our study can provide useful information to city governments and planners. The research contents and results of this study can reinforce the decision-making processes in the development of other resource-based shrinking cities.
-
Hegang is located in the northeast of Heilongjiang Province, China. It is one of the central cities in the northeast of Heilongjiang Province and an important national energy city. Fig. 1 shows the geographical location of Hegang. Hegang covers an area of 14 684 km2 and has six municipal districts, namely Dongshan District, Nanshan District, Xiangyang District, Gongnong District, Xingshan district, Xingan district. Additionally, there are two counties under the jurisdiction of Hegang, respectively, Luobei and Suibin. Within the 21 resource-based cities in Northeast China defined by The National Plan for Sustainable Development of Resource-based Cities (2013–2020), Hegang is classified as a recession group (He et al., 2017).

Figure 1. Location of Hegang City, China
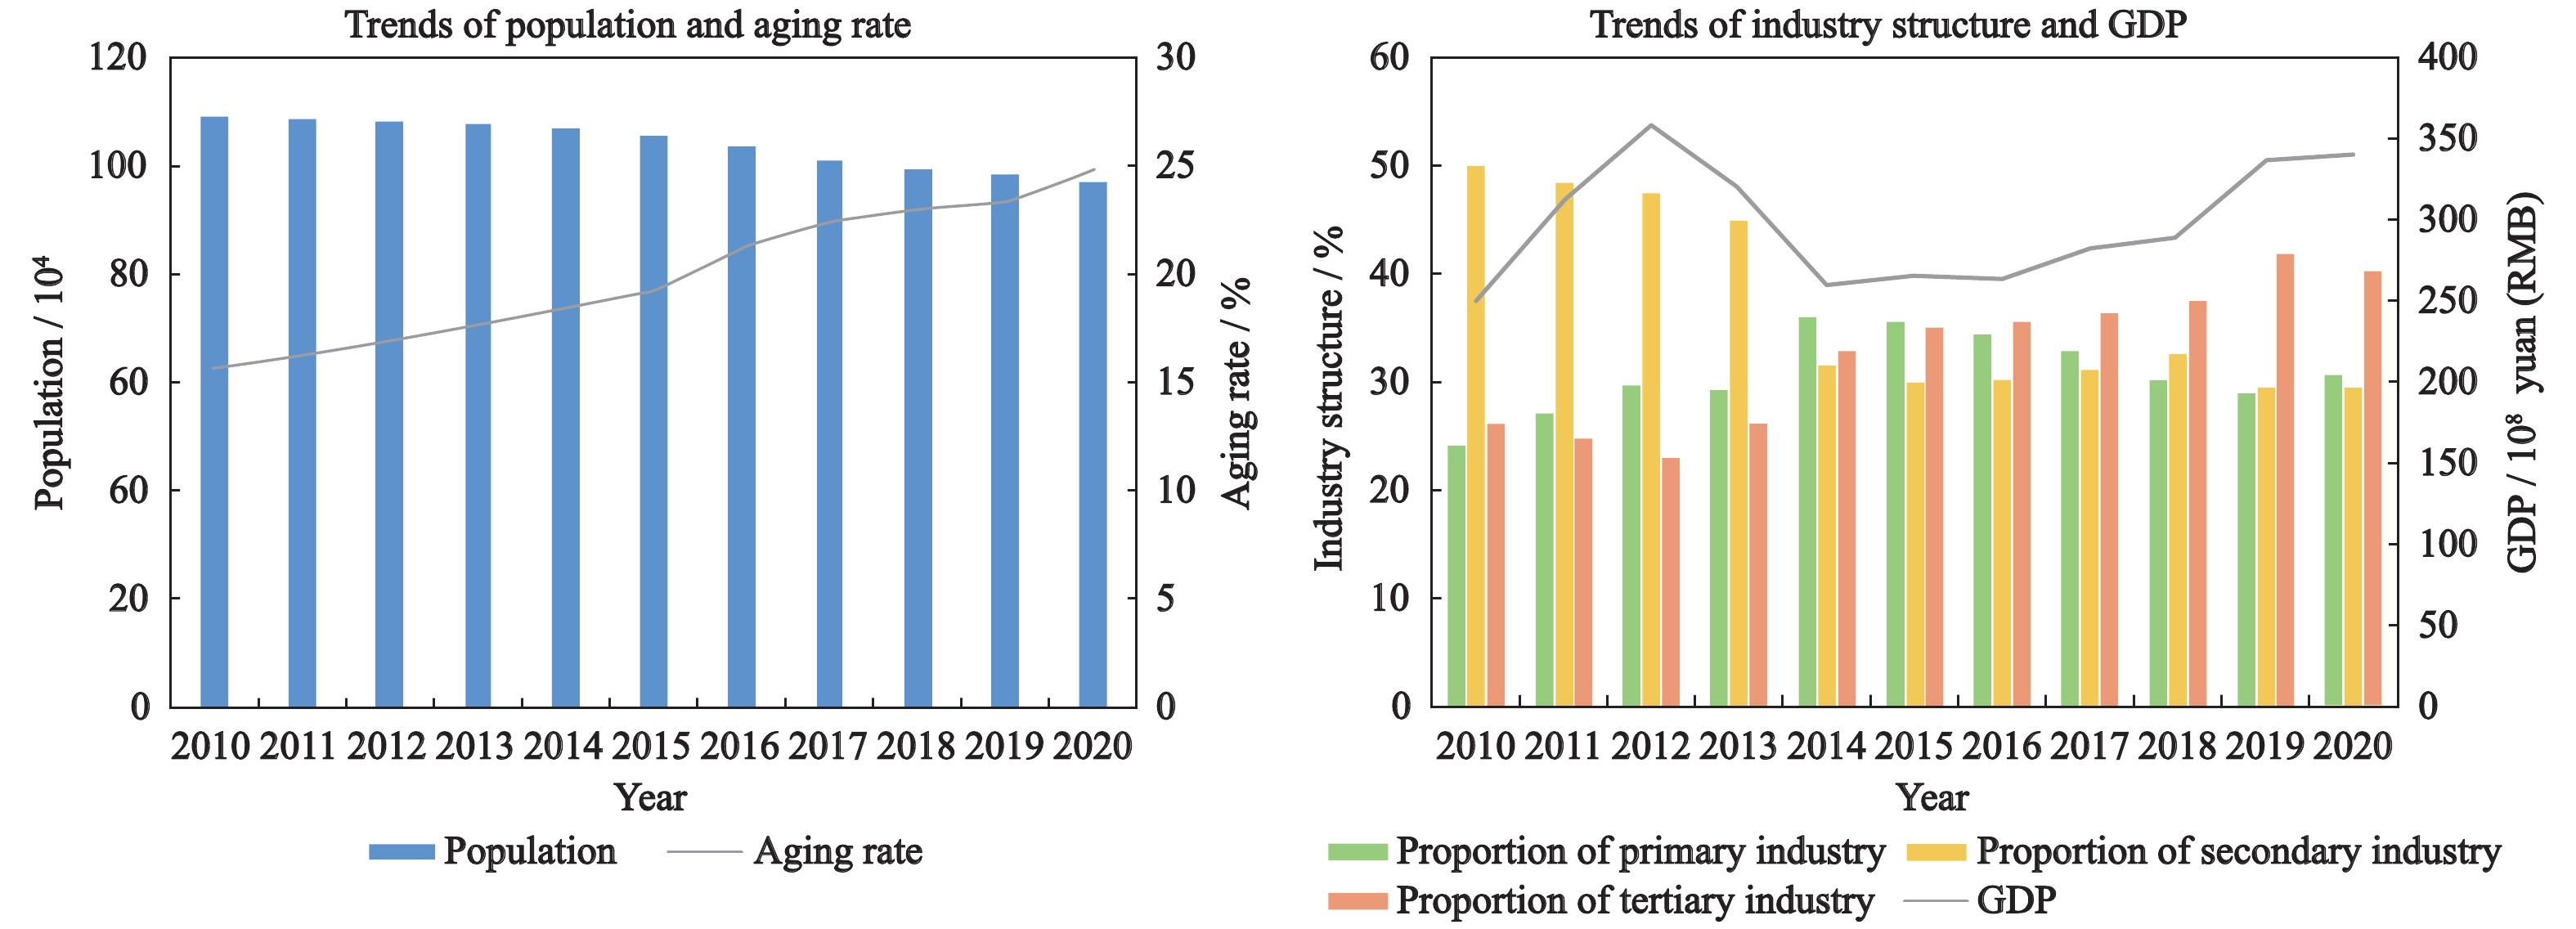
According to the Seventh National Census of China, the total population of Hegang is about 891 thousand in 2020. Compared with approximately 1058 thousand people in the Sixth National Census in 2010, the population of six districts and two counties in the city decreased about 167 thousand, a decrease of 15.81%, and the annual average decline rate is 1.7%. Among the population composition of Hegang, the elderly population aged 60 and above have increased 63 thousand comparing with the Sixth National Census, and the proportion increased by 9.75%. The proportion of the population aged over 60 is 1.1% higher than that of the whole province and 5.62% higher than that of the whole country. In recent years, the GDP of Hegang has shown a trend of slow growth, increasing from 25.1 billion yuan (RMB) in 2010 to 34.02 billion yuan (RMB) in 2020 (Hegang Municipal People’s Government, 2021). The proportion of industrial structure in Hegang has evolved from 24: 50: 26 in 2010 to 30.5: 29.3: 40.2 in 2020 (Hegang Bureau of Statistics, 2010–2020). Fig. 2 shows the change trend of population and industrial contribution rate in Hegang. Finally, it is worth mentioning that Hegang is faced with many problems, such as lagging behind of economic development, resource depletion, flabby extended and substitute industry, an unbalanced industrial structure, brain drain, unemployment, poverty and so on.

Figure 2. The evolution of demographic and economic in Hegang City, China
-
Shrinking cities emphasize that population loss is caused by structural crises, such as post industrialization, economic and social transformation, and other complex factors interact in different cities and regions, thus breaking the relatively balanced pattern of the urban system itself (Alves et al., 2016). Fig. 3 depicts the conceptual model of urban shrinkage. There is an association between city shrinkage and its external environment. The external impacts of cities may be globalization or the adjustment of production structure, or governance arrangements operating on different spatial levels (Haase et al., 2016). Moreover, the development and shrinkage of cities often interact with each other. Literatures suggest that population loss and economic recession are the main characteristics of urban shrinkage (Wolff and Wiechmann, 2018; Li et al., 2020). In industry dimension, the hypothesis of structural change holds that the continuous development of the economy will lead to the transformation of the economic center and the upgrading of the industrial structure (Liu et al., 2007). In terms of built environment, urban shrinkage is also accompanied by the abandonment of public service facilities (Wu and Sun, 2017). Therefore, variable selection in this paper mainly includes four dimensions: demographic profile, economic performance, industry structure and built environment.

Figure 3. Conceptual model of urban shrinkage (Adapted from Haase et al., 2016)
In demographic profile dimension, population aging widely exists in developed and developing countries, and there is an obvious correlation with the shrinkage of cities (Feldhoff, 2013; Liu and Yang, 2017). Researches have confirmed that the aggravation of population aging trend is one of the important formation mechanisms of urban shrinkage in China (Zhang et al., 2018). The dependency ratio is defined as the ratio of dependents (under 18 and over 60) to the working age population (between 18 and 60). The larger the dependency ratio, the more dependent people the labor force bears per capita (Hartt, 2018a). As an important population factor, resident population can reflect the overall situation of the population in China. The natural population growth rate can reflect the tendency and speed of population growth. Therefore, the natural growth rate, aging rate, dependency ratio and resident population were selected as the demographic profile dimension factors affecting the urban shrinkage of Hegang. In economic performance dimension, GDP per capita is generally used to measure the degree of economic development of a country or region (Zhang et al., 2013). Local financial revenue is directly related to the industrial structure and economic operation quality of the city. At the macro level, investment is one of the ‘troikas’ to promote economic development (Li and Zou, 2018). Total fixed assets investment plays a key role in reflecting changes in economic structure and quality. Foreign direct investment can reflect the openness of a particular region. Total retail sales of consumer goods can not only reflect the domestic demand and consumption capacity of the city, but also reflect the operation of the urban economy. Affected by the economic recession caused by urban shrinkage, the overall unemployment rate of city is generally high (Nefs et al., 2013; Mallach, 2017). Therefore, GDP per capita, local financial revenue, total fixed assets investment, foreign direct investment, total retail sales of consumer goods and unemployment rate were selected as the economic performance factors. In industry structure dimension, changes in the industrial structure play an important role in economic development (Yu, 2015). This paper uses the proportion of secondary industry and the proportion of tertiary industry to reflect the industrial structure of Hegang. As a typical resource-based city, Hegang has more than 30 types of mineral resources, with coal and graphite being the most important resources to the country. Subjecting to data availability limitations, we choose production value of mining industry to reflect the mining industrial situation in Hegang. Resource dependence refers to the dependence of economy on resources. The ratio of mining industry employees to the total population at the end of the year is used to measure resource dependence (Li and Zou, 2018). In built environment dimension, good public facilities are more likely to attract people to settle down in a city (Guimaraes et al., 2016; Guo and Li, 2019). Per capita public green area and per capita road area were selected to reflect the infrastructure facilities of Hegang. The consequences of urban shrinkage impacts on urban development and the housing market are various, such as vacancies and the disposal of large numbers of buildings (Du et al., 2020b). Similarly, the economic recession that accompanies the shrinkage of cities will lead to a downturn in the real estate market (Haase et al., 2014; Lee et al., 2016; Wang and Ye, 2020), which in turn will affect sales of commercial housing and the start of new housing. Sales area of commercial housing and housing construction starts rate were chosen as the representative variables. Housing construction starts rate is defined as the ratio of new construction area to housing construction area for the current year. Urban shrinkage is generally reflected in the loss of population, which in turn causes the government to reduce the corresponding level of public services (Deng and Zhang, 2020). This is particularly evident in education services, where the cities in population outflow lack the incentive to upgrade the level of education services in the region. Medical service is directly related to the public’s health and is the most basic need of the public (Zhong et al., 2016). With the continuous advance in means of data collection, the amount of POI data in recent years has been showing an upward trend. In order to reduce the error that may be caused by use of absolute quantity. Here, we choose the ratio of POI of science and education cultural services to POI in this year, and the ratio of POI of medical care services to POI in this year represent the education and medical service facilities in Hegang. POI data is more granular than traditional statistics. Mixed and multifunctional land use have been identified as being able to promote urban vibrancy (Koster and Rouwendal, 2012; Yang et al., 2017). Referring to the research of Liu and Long (2016), using point of interest (POI) data, a mixed index can be computed to denote the degree of mixed land use. This study included 21 variables (Table 1). The data sources mainly include the Heilongjiang Statistical Yearbook (Heilongjiang Bureau of Statistics, 2006–2020), Hegang Statistical Yearbook (Hegang Bureau of Statistics, 2006–2020), China City Statistical Yearbook (Department of Urban Surveys of National Bureau of Statistics of China, 2006–2020), China Urban Construction Statistical Yearbook (Ministry of Housing and Urban-Rural Development of the People’s Republic of China, 2006–2020), Statistical Bulletin of National Economic and Social Development of Hegang City (Hegang Bureau of Statistics, 2005–2019). Moreover, POI data are obtained from the AutoNavi, a leading navigation and location-based service provider in China. All data of each variable was standardized, which makes the across time periods comparison more robust.
Table 1. List of include demographic profile, economic performance, industry structure and built environment variables to research population shrinkage of Hegang
Variable type Variable Unit Source Demographic profile Natural growth rate ‰ China City Statistical Yearbook Aging rate % Statistical Bulletin of National Economic and Social Development of Hegang City Dependency ratio % Resident population Ten thousand China Urban Construction Statistical Yearbook Economic performance GDP per capita Yuan (RMB) per person Heilongjiang Statistical Yearbook Local financial revenue Ten thousand yuan Hegang Statistical Yearbook Total fixed assets investment Hundred million yuan Heilongjiang Statistical Yearbook Foreign direct investment
Total retail sales of consumer goodsTen thousand yuan
Ten thousand yuanChina City Statistical Yearbook
China City Statistical YearbookUnemployment rate % Hegang Statistical Yearbook Industry structure Proportion of secondary industry % China City Statistical Yearbook Proportion of tertiary industry % China City Statistical Yearbook Resource dependence % China City Statistical Yearbook Production value of mining industry Ten thousand yuan Hegang Statistical Yearbook Built environment Per capita public green area
Per capita road aream2
m2Heilongjiang Statistical Yearbook
Heilongjiang Statistical YearbookSales area of commercial housing
Housing construction starts rate
Ratio of EPOIs
Ratio of MPOIskm2
%
%
%Hegang Statistical Yearbook
Hegang Statistical Yearbook
The AutoNavi
The AutoNaviMixed land use % The AutoNavi Notes: POI refers to Point of Interest. Ratio of EPOIs represents the ratio of the number of science, education and cultural service POIs to all POI quantities in this year. Ratio of MPOIs represents the ratio of the number of medical care services POIs to all POI quantities in this year. The data of aging rate and dependency ratio are from Economic and social development statistical bulletin of Hegang. The data collected annually over a span of 15 years from 2005 to 2019 -
The cross-correlation function can not only calculate the correlation of two variables at one point in time, but also calculate the correlation at multiple points in time (Hoekveld, 2012). Cross-correlation between two functions means that an infinite integral that multiplies two functions by making complex conjugate and reverse translation respectively. In other words, an infinite integral multiplied by the second function after conjugation and translation of the first function. Cross-correlation analysis can reveal the intensity and direction of correlation between two time series. The cross-correlation coefficient is calculated with Equation (1) or Equation (2).
$$ \mathop R\nolimits_{fh1} (x) = \int_{ - \infty }^\infty {f(x)h(x + x'){\text{d}}} x $$ (1) $$ \mathop R\nolimits_{fh2} (x) = \int_{ - \infty }^\infty {f(x - x')h(x){\text{d}}x} $$ (2) where
$x$ stands for the integral variable, x′ stands for the parameter variable.$ {R}_{fh}\left(x\right) $ is a cross-correlation function. The cross-correlation of two functions$ f\left(x\right) $ and$ h\left(x\right) $ is defined by the infinite integral with x. -
Cross-correlation can measure the time and direction, as well as the strength of the relationships between variables. Although cross-correlation analysis has the above advantages, there are still some limitations. That is, using cross-correlation alone can lead to ambiguous inferences when studying several time series simultaneously (Baccalá and Sameshima, 2001; Hartt, 2018a). In addition, because the seemingly open nonlinear system may be closed due to a wide range of feedback loops, there is a risk of false negative results (Billings, 2013). To overcome the limitations of cross-correlation analysis, we introduce partial-correlation analysis to eliminate the risk of false correlation as much as possible. Partial-correlation is a multi-factor system of geographic systems, also known as ‘net correlation’, ‘pure correlation’ or ‘conditional correlation’ (Vargha et al., 2013). The change of one element will affect the change of other elements, so there are different relations among them (Park et al., 2015). Partial-correlation is the net correlation or pure correlation of two random variables when the effects of other variables are excluded (Kim et al., 2011). In other words, it is the conditional correlation of two random variables when the rest variables in the same system take a given value.
$$ R = \left( {\begin{array}{*{20}{c}} {{r_{11}}}&{{r_{12}}}&{{r_{13}}} \\ {{r_{21}}}&{{r_{22}}}&{{r_{23}}} \\ {{r_{31}}}&{{r_{32}}}&{{r_{33}}} \end{array}} \right) = \left( {\begin{array}{*{20}{c}} 1&{{r_{12}}}&{{r_{13}}} \\ {{r_{21}}}&1&{{r_{23}}} \\ {{r_{31}}}&{{r_{32}}}&1 \end{array}} \right) $$ (3) $$ \mathop R\nolimits_p = \left( {\begin{array}{*{20}{c}} 1&{{r_{12.3}}}&{{r_{13.2}}} \\ {{r_{21.3}}}&1&{{r_{23.1}}} \\ {{r_{31.2}}}&{{r_{32.1}}}&1 \end{array}} \right) $$ (4) where R stands for correlation coefficient matrix, Rp stands for partial-correlation coefficient matrix. Suppose that there are three elements or variables X1, X2, X3 and the correlation coefficient matrix is shown in the Equation (3). r12 represents the correlation coefficient between variables X1 and X2 and so on. Because it is a symmetric correlation matrix, only r12, r13 and r23 need to be calculated. The partial-correlation coefficient matrix is shown in the Equation (4). In fact, the partial-correlation coefficient matrix is also a symmetric matrix. The number after the subscript dot represents the variable that remains unchanged. For example,
$ {r}_{12.3} $ means the X3 remains unchanged. -
The rise of complex network research further promotes the development of network visualization technology and puts forward higher requirements for it (Sun et al., 2010). Moreover, through the method of network visualization, the feedback of each factor is displayed intuitively, and the dynamic relationship between key variables in the system is further studied. The first network visualization method is used to obtain the feedback relationship between variables in the network. Each variable selected is represented by a point in the graph, and the colors of the points represent different variable types. In addition, each line in the figure connecting the two variables represents a significance test passing the cross-correlation and partial-correlation. Positive relationships are indicated by red lines, and negative relationships are indicated by black lines. As a result, lines with arrows indicate that there is a time delay between the two variables in the cross-correlation analysis. Because there are a large number of edges in the whole network, the time lag associated with each relationship is not visually represented. This paper is inspired by system dynamics for a better understanding of the multidimensional process of urban shrinkage and the feedback mechanism of the key factors of urban shrinkage. Therefore, the second network visualization method is used to check the cyclic feedback relationship of key factors. According to the feedback characteristics of mutual cause and effect of the internal components of the system, system dynamics explores the root cause of the problem from the internal structure of the system (Forrester, 2003; Saeed, 2014). The variables that precede a change in the key variable are indicated on the left side by arrows pointing in key variables, and the variables that follow a change in the key variable are indicated on the right side by arrows pointing away from key variables (Hartt, 2018a). In addition, the variables of the complete loop indicate that there is no time delay between the correlations of the two variables in the cross-correlation analysis. Similarly, positive relationships are indicated by red lines, and negative relationships are indicated by black lines.
-
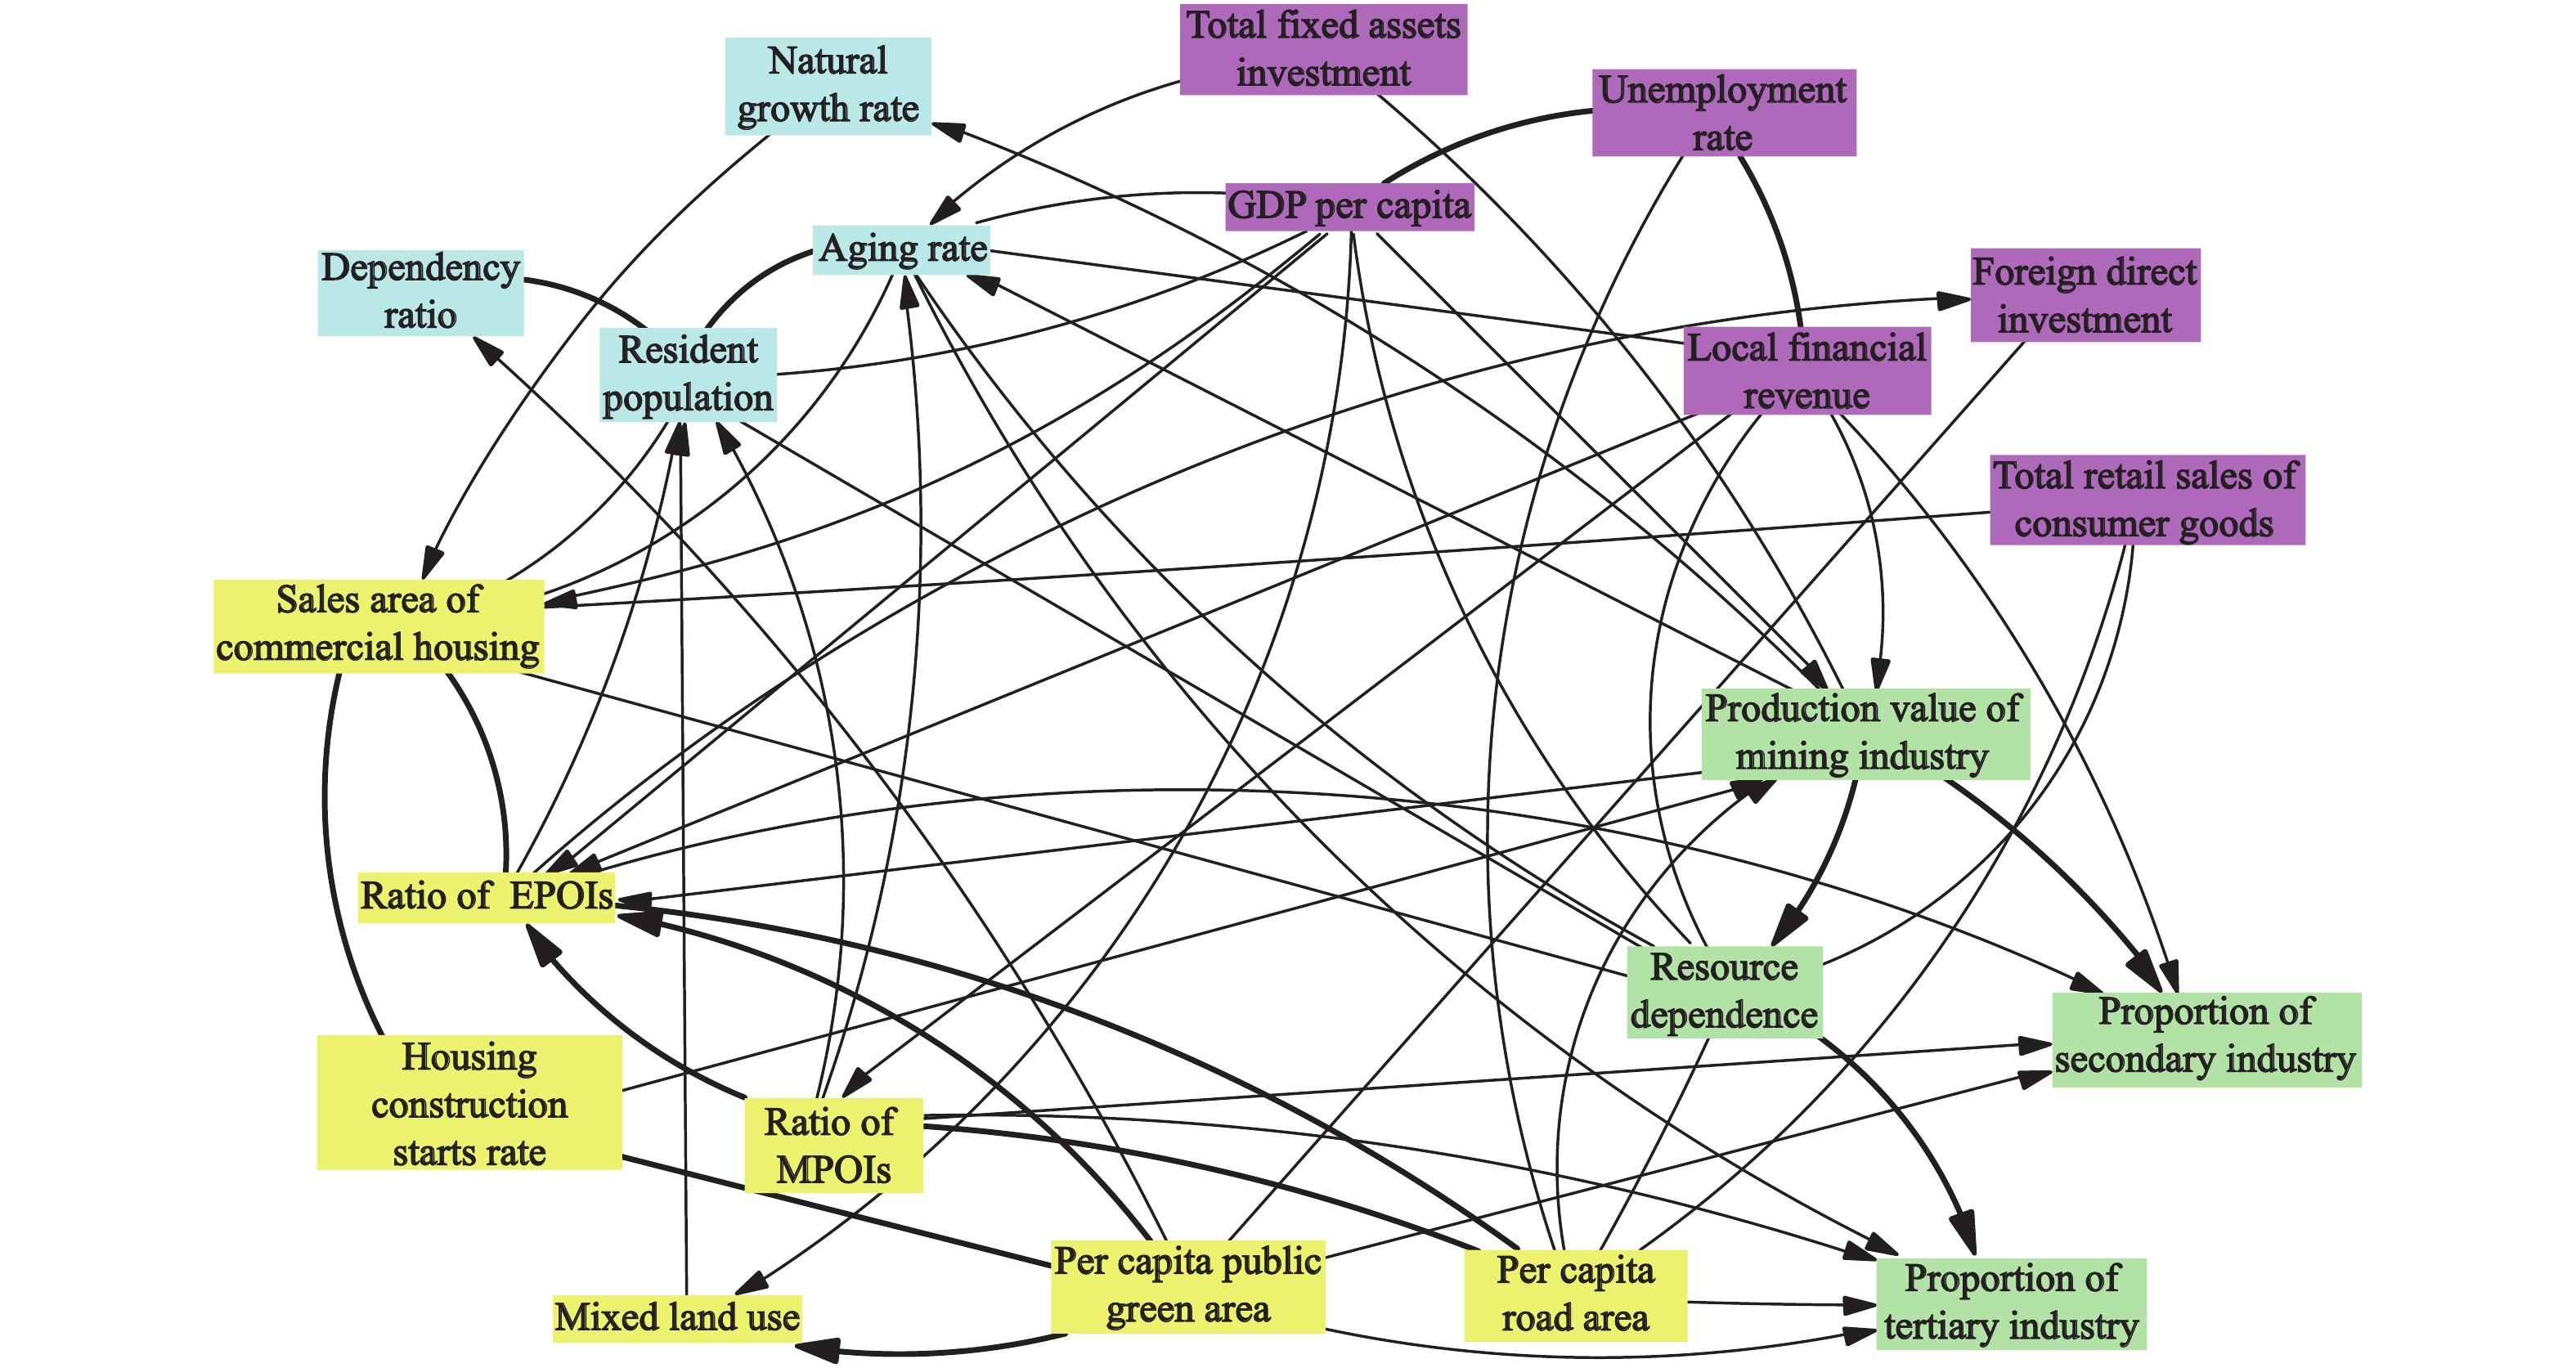
Fig. 4 shows the cross-correlation and partial-correlation network maps of Hegang. We use the first network visualization method described above to evenly distribute 21 variables on the edge of the circle. The edges in the map depict the statistically significant relationships between the demographic profile, economic performance, industry structure and built environment variables. Among all correlations of the 21 variables interacted with each other, 64 edges in the graph were preserved to present the correlations that pass the cross-correlation test and partial-correlation test respectively. Among all the 64 correlations, 27 are positive, accounting for 42.2%, and 37 negative correlations, accounting for 57.8%. In demographic profile dimension, the most connected variable is aging rate, with a total of nine edges, including five edges indicating positive correlation and four edges indicating negative correlation. In economic performance dimension, GDP per capita is the most connected with other variables, with a total of eight edges. There is one edge indicating positive correlation and seven edges indicating negative correlation. In industry structure dimension, the most connected variable is the production value of mining industry, with a total of 10 edges, including three edges indicating positive correlation and seven edges indicating negative correlation. In built environment dimension, the most connected variable is the ratio of EPOIs, with a total of 10 edges. There are five edges indicating positive correlation and five edges indicating negative correlation. For visual simplicity, time delays are not displayed in the figure but discussed in the next section.

Figure 4. Correlation network map of Hegang City, China. Meaning of EPOI and MPOI are same as Table 1. The number in the brackets denotes how many edges are connected to this particular variable
Scrutinizing these variables and their relationships in the network can help us unlock the complexity of the network. This paper mainly studies the dynamic relationships and trends of key variables, which are more related to other variables. For the selection of key variables, the contribution rate of each variable to the overall network is calculated based on the number of connecting edges between each variable and other variable. Because there are large number of significant relationships in the correlation network, exploring every relationship is not within the scope of this paper. We employ the 11 variables with the top 70% cumulative contribution rate as the key variables. The following section will highlight examples of dynamic relationships and trends in production value of mining industry, ratio of EPOIs, resource dependence, aging rate, GDP per capita, sales area of commercial housing, resident population, ratio of MPOIs, local financial revenue, per capita public green area, per capita road area. For the convenience of research, we compare and analyze the key variables with similar characteristics.
-
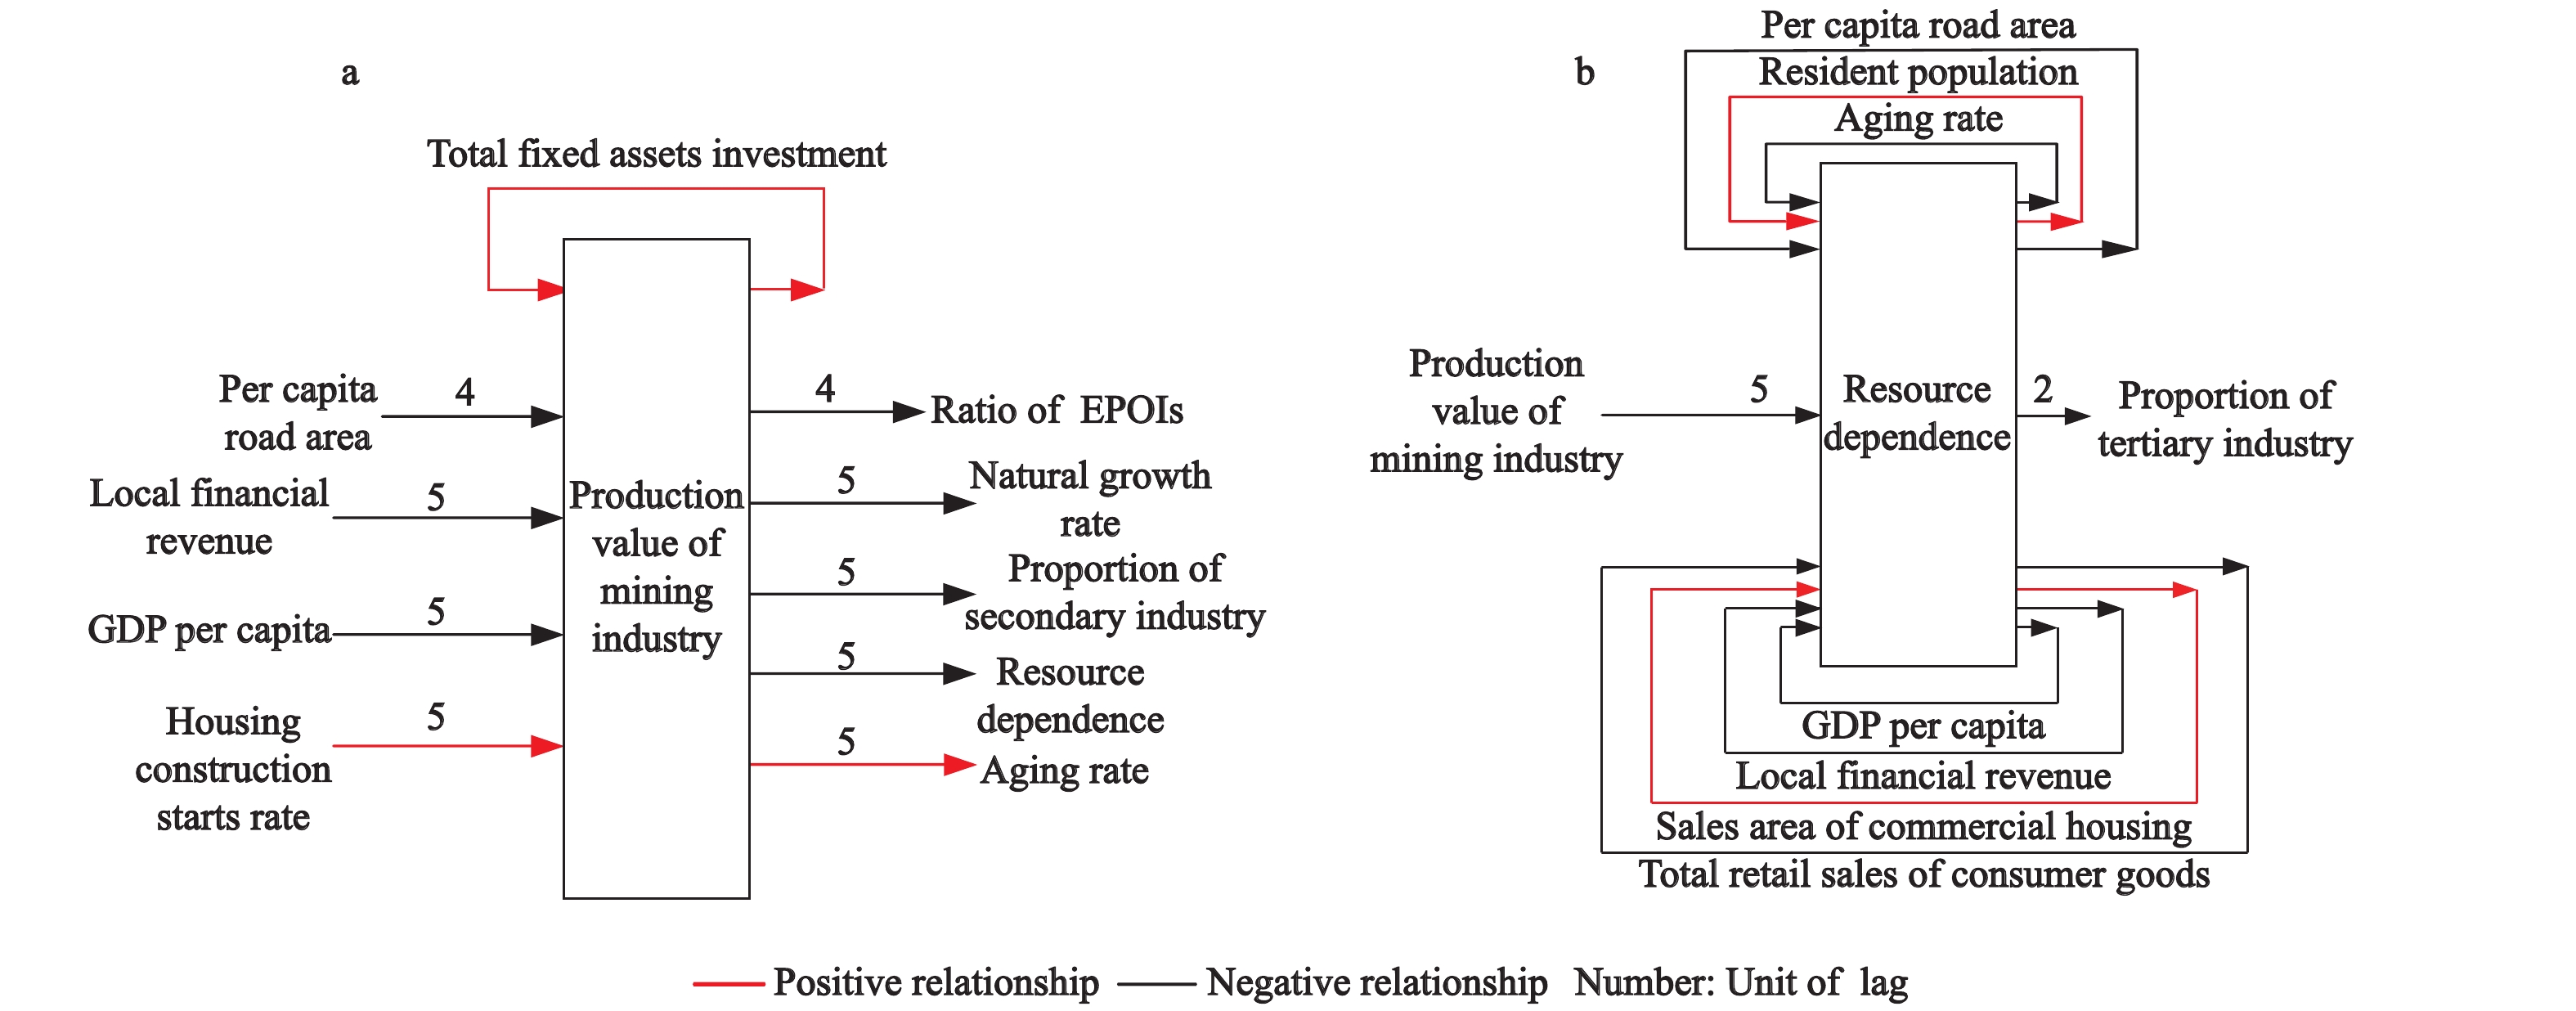
Fig. 5 illustrates that production value of mining industry and resource dependence in Hegang are highly connected to other variables in the network. The number above the arrow represents the number of years with time lag between the two variables. The length of arrow is proportionate to the length of the time lag. Production value of mining industry has 10 connections and three of those are positive, seven of those are negative. Resource dependence has nine connections and two of those are positive, seven of those are negative. There is a lag of four to five years between the change of production value of mining industry and other variables. Hegang’s production value of mining industry showed an upward trend from 2005 to 2012 and a downward trend from 2012 to 2019. Most of the correlations of resource dependence and other variables have no time delay. From 2005 to 2019, resource dependence generally showed a downward trend. As mining industry has been the pillar industry of Hegang for a long time, with the decline of leading industries, Hegang’s employment has decreased significantly. This is followed by a reduction in the attractiveness of cities and an outflow of large number of people.

Figure 5. Dynamic variable relationships of key shrinkage variables for the a) production value of mining industry and b) resource dependence. Meaning of EPOI is same as Table 1
Fig. 6 shows the circular feedback relationships between the forward and backward correlation variables of the GDP per capita and local financial revenue. In the same way, the number above the arrow represents the number of years with time lag between the two variables. The length of arrow is proportionate to the length of the time lag. There are eight forward and backward correlation variables of GDP per capita, and seven forward and backward correlation variables of local financial revenue. GDP per capita and local financial revenue have similar correlations on the variables of demographic profile dimension and built environment dimension. As variables of economic performance dimension, the changes of GDP per capita and local financial revenue have strong correlations with the changes of public service facilities, and there is a time delay about two to three years. In addition, the change of local financial revenue is related to the industry structure, with a time delay of three to four years. The change trend of GDP per capita and local financial revenue from 2005 to 2019 is similar. The GDP per capita and local financial revenue showed an upward trend from 2005 to 2012, which is consistent with the change trend of the production value of mining industry. After the GDP per capita and local financial revenue showed a downward trend from 2012, they showed a slow growth trend since 2016. However, in recent years, Hegang’s economic development is still weak and its development power is obviously insufficient.

Figure 6. Dynamic variable relationships of key shrinkage variables for the a) GDP per capita and b) local financial revenue. Meaning of EPOI and MPOI are same as Table 1
Fig. 7 illustrates that aging rate and resident population in Hegang are highly connected to other variables in the network. The number above the arrow represents the number of years with time lag between the two variables. The length of arrow is proportionate to the length of the time lag. Aging rate has nine connections and five of those are positive, four of those are negative. Resident population has eight connections and five of those are positive, three of those are negative. As variables of demographic profile dimension, the relationship between both aging rate and resident population and other economic performance variables is mostly without time delay. We noticed that there are reciprocal relationships between aging rate and both the resident population and the sales area of commercial housing respectively. There is a negative relationship between aging rate and sales area of commercial housing, and a positive relationship between resident population and sales area of commercial housing. The possible reason is that the aging rate of Hegang has been on the rise since 2005, the root cause of the rising aging rate is the continuous outflow of young and middle-aged labor force caused by the decrease of employment. The decrease of resident population leads to the reduction of demand for newly built housing. On the other hand, the elderly population is unlikely to buy newly built housing. In addition, we noticed that there is also a correlation between mixed land use and resident population. A decrease in the mixed land use is followed two years later by a decrease in resident population. The reason may be that the degree of mixed land use can reflect the vitality of the city, and population is the most important factor affecting urban vitality. The change trend of mixed land use is similar to the key variables in the economic performance dimension, GDP per capita and local financial revenue.

Figure 7. Dynamic variable relationships of key shrinkage variables for the a) aging rate and b) resident population. Meaning of EPOI and MPOI are same as Table 1
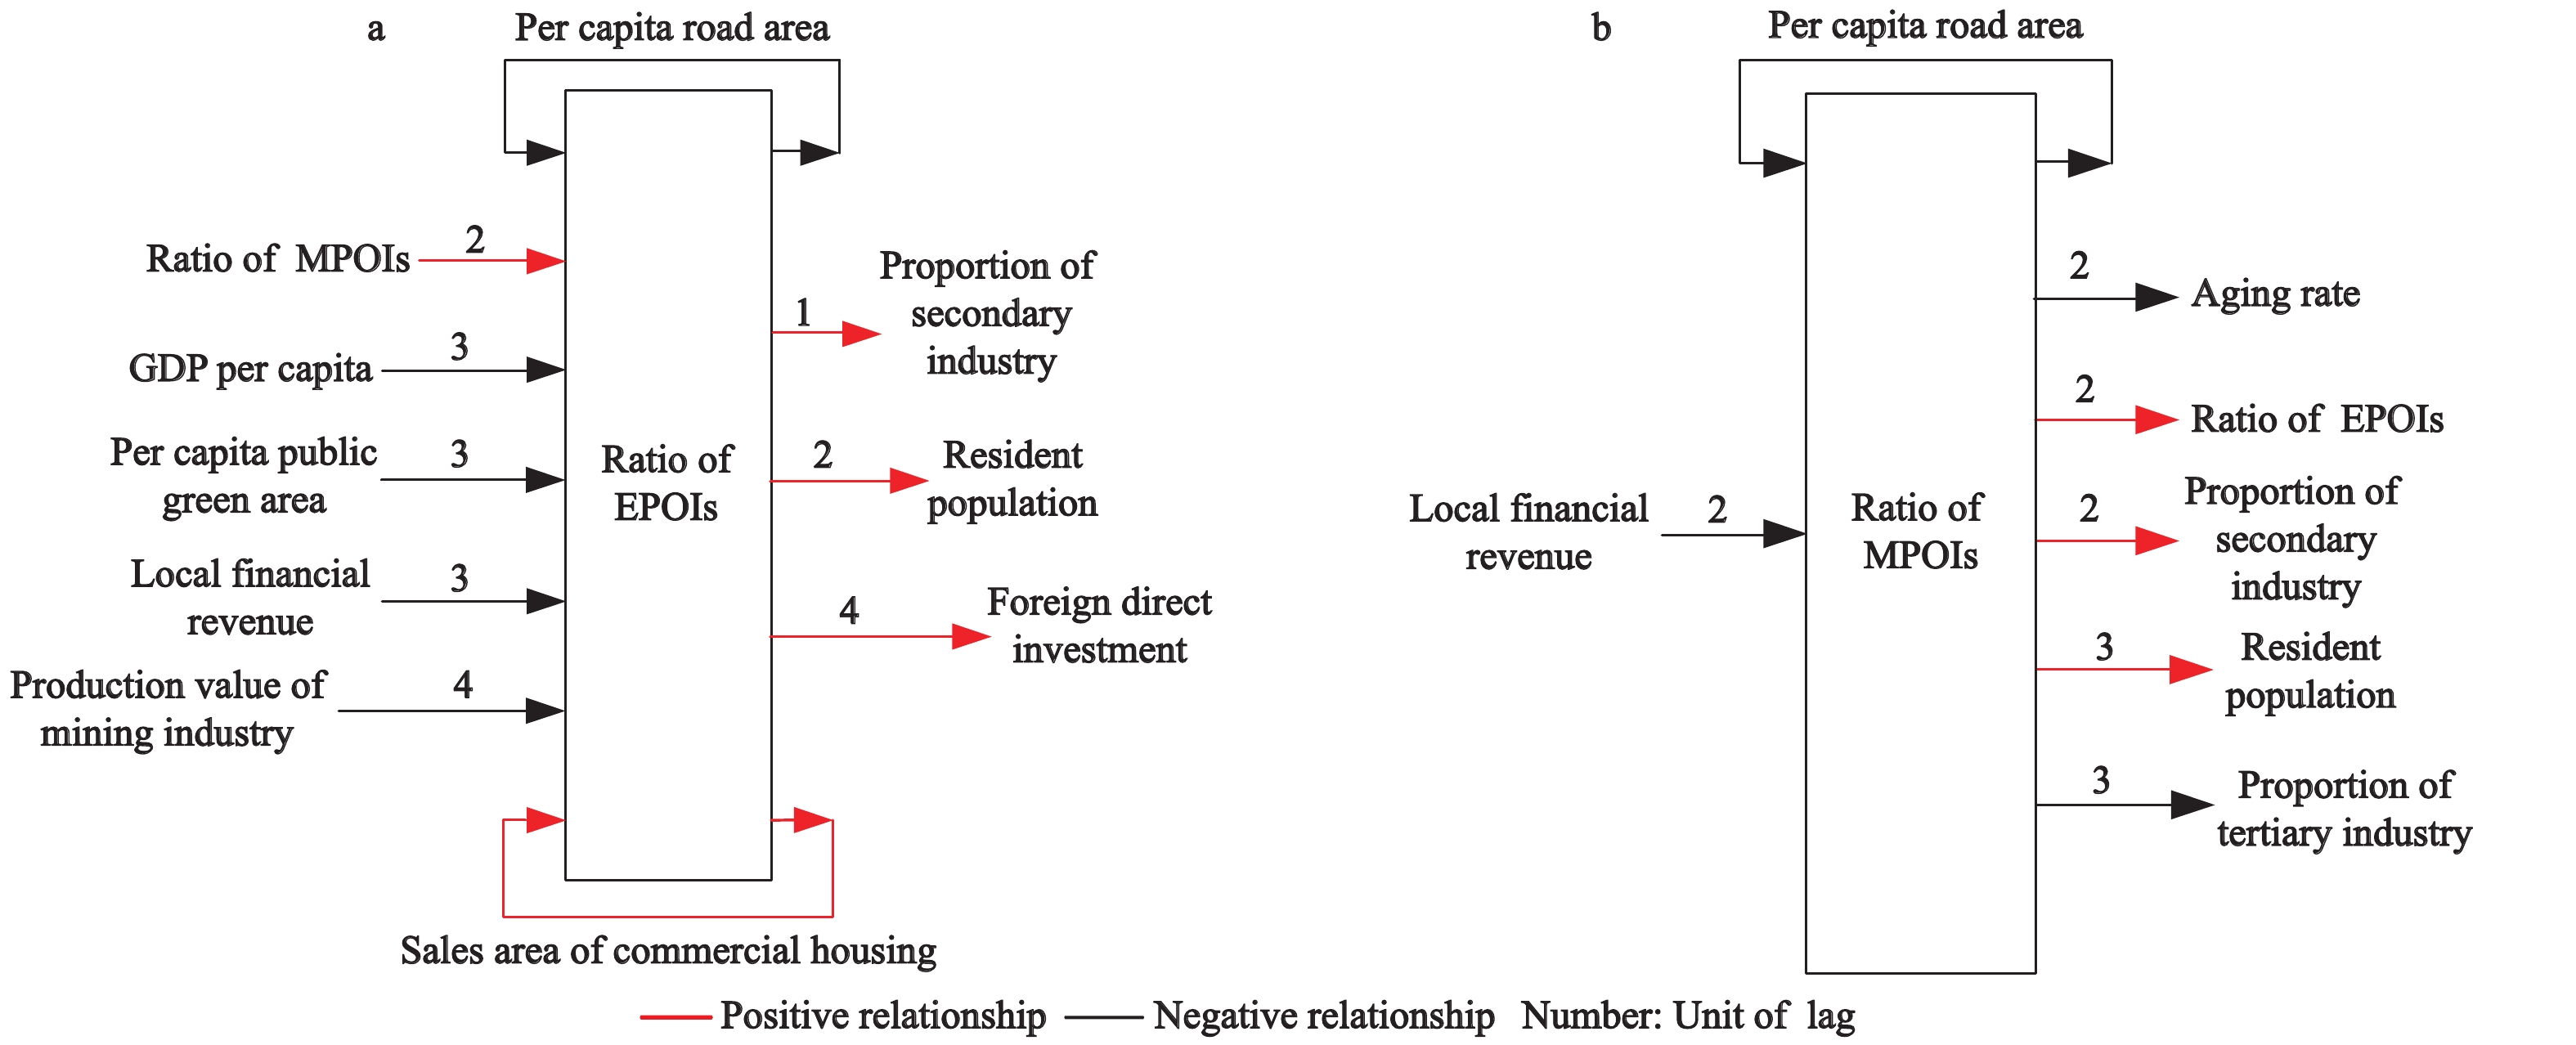
Fig. 8 shows the circular feedback relationships between the forward and backward correlation variables of the ratio of EPOIs and ratio of MPOIs. The number above the arrow represents the number of years with time lag between the two variables. The length of arrow is proportionate to the length of the time lag. There are 10 forward and backward correlation variables of ratio of EPOIs and seven forward and backward correlation variables of ratio of MPOIs. Public services facilities, represented by scientific, education and cultural services and medical care services, have a time delay of about two to three years in relation to demographic profile and economic performance and industry structure variables. The possible reason is that the higher the quality of public services, the greater the attraction to all kinds of talents and resources. When population loss and economic recession occur, the market can perceive this change. Therefore, the supply of public service facilities will be changed, and there will be a certain time delay. There is a positive correlation between scientific, education and cultural services and medical care services.

Figure 8. Dynamic variable relationships of key shrinkage variables for the a) ratio of EPOIs and b) ratio of MPOIs. Meaning of EPOI and MPOI are same as Table 1
Fig. 9 illustrates that per capita public green area and per capita road area in Hegang are highly connected to other variables in the network. The number above the arrow represents the number of years with time lag between the two variables. The length of arrow is proportionate to the length of the time lag. Per capita public green area has seven connections and three of those are positive, four of those are negative. Per capita road area has seven connections and two of those are positive, five of those are negative. The public service facilities, represented by per capita public green area and per capita road area, has a time delay of about four to five years from the change of industry structure. There is a positive correlation between proportion of tertiary industry and both the per capita public green area and per capita road area, and a negative correlation between proportion of secondary industry and both the per capita public green area and per capita road area. The proportion of secondary industry in Hegang showed an upward trend from 2005 to 2011 and a fluctuating downward trend from 2011 to 2019. The per capita public green area and per capita road area of Hegang have been rising slowly from 2005 to 2019.

Figure 9. Dynamic variable relationships of key shrinkage variables for the a) per capita public green area and b) per capita road area. Meaning of EPOI and MPOI are same as Table 1
Fig. 10 shows the circular feedback relationships between the forward and backward correlation variables of the sales area of commercial housing. The number above the arrow represents the number of years with time lag between the two variables. The length of arrow is proportionate to the length of the time lag. There are eight forward and backward correlation variables of sales area of commercial housing and five of those are positive, three of those are negative. Most of the relationships between the sales area of commercial housing and both demographic profile and economic performance dimension variables have no time delay and are synchronous. The possible reason is that when population loss, the economic growth is weak, and the demand for new housing will decrease. The sales area of commercial housing in Hegang showed an upward trend from 2005 to 2010 and a fluctuating downward trend from 2010 to 2019. GDP per capita and natural growth rate also have correlation on the sales area of commercial housing. Which shows that the real estate market in Hegang is very sensitive to the changes of urban economy and population loss.

Figure 10. Dynamic variable relationships of key shrinkage variables for the sales area of commercial housing. Meaning of EPOI is same as Table 1
-
In order to better understand the relationship among the four dimensions variables of demographic profile, economic performance, industry structure and built environment, we have integrated many of the relationships in the subsection 3.2.
As can be seen from Fig. 11, the built environment variables have the strongest internal correlation. The internal correlation of demographic profile, economic performance and industry structure variables is relatively weak. The key variables in each dimension are strongly related to other dimension variables, and the key variables are placed close to the inside of the graph. In order to gain a clearer understanding of the change trend of built environment variables, Fig. 12 shows the trend of them.

Figure 11. Complex correlations between variables. Different shading colors represent different variable types. the thick black line indicates the internal correlation between variables of the same type. The thin black line indicates the external correlation between different types of variables.

Figure 12. Trends of built environment variables of Hegang in 2005–2019. Meaning of EPOI and MPOI are same as Table 1.
From Fig. 12, we can see the variables that rise first and then decrease gradually are ratio of MPOIs, ratio of EPOIs, sales area of commercial housing, housing construction starts rate. The variables showing an upward trend of fluctuation are per capita public green area and per capita road area. Among them, the mixed land use showed an upward trend from 2005 to 2011 and a fluctuating downward trend after 2011. However, due to the small value, this change trend is not obvious. In order to comprehend the correlation between the variables of each dimension and other variables, we count and classify the types of variables related to key variables.
From Fig. 13, we can see the following features. Resident population is mainly related to the built environment variables. Aging rate is mainly related to industry structure and economic performance variables. The economic performance variables represented by GDP per capita and local financial revenue are mainly related to the variables of industry structure and built environment. Resource-based industries and resource dependence are mainly related to economic performance and built environment variables. Built environment variables are mainly related to the built environment variables, followed by industry structure variables. The sales area of commercial housing is mainly related to demographic profile variables. The process of urban shrinkage in Hegang during the research period is shown in Fig. 14.

Figure 13. Classification of variables related to key shrinkage variables. Meaning of EPOI and MPOI are same as Table 1. D: Demographic profile variables; E: Economic performance variables; I: Industry structure variables; B: Built environment variables

Figure 14. The process of urban shrinkage in Hegang City, China. The ‘||’ and one-way arrow represent that there is time delay in the relationship between the two variables, and the number represents the years of time delay. The two-way arrow indicates that there is no time delay in the relationship between the two variables
From Fig. 14, we can see that the shrinkage process of Hegang is very complex, many variables have correlations and have a certain time delay. In addition, our research find that Hegang’s urban shrinkage is accompanied by the following characteristics. First, as the pillar industry in Hegang, there is a time delay of about four to five years between the mining industry and the changes of demographic profile, economic performance and built environment variables. Most of the correlations between resource dependence and other dimensional variables have no time delay, indicating that Hegang’s development has formed a path dependence on resource-based industries. The possible reason is that Hegang, as a typical coal resource-based city, once the production value of resource-based industries changes, it will have a great impact on other aspects. Second, the time lags between demographic profile and economic performance variables are not obvious, and the time lags between real estate market and both demographic profile and economic performance variables are not obvious either. This shows that population loss and economic change are interactive, and the real estate market has a certain sensitivity to perceive population loss and economic change. The possible reason is that when the economic growth is weak, the jobs that can be provided will decline relatively, which will stimulate large number of population loss. A constantly losing population will reduce the purchasing power of the real estate market, resulting in the downturn of the real estate market. Third, the government led public service facilities represented by roads and green area have a time lag of four to five years with the changes of demographic structure and industry structure respectively. The market led public service facilities represented by POI have a time lag of two to three years with the changes of demographic structure, economic and industry structure respectively. Which shows that market led public service facilities are more sensitive to the changes of other dimensional variables than government led public service facilities. The possible reason is that due to the profit seeking nature of the market, once feels the economic recession and population loss, it will make corresponding rapid adjustment strategies.
-
It is important to solve the population shrinkage and economic recession of resource-based cities, especially for China in the stage of rapid development. Based on Hartt’s (2018a) research, this paper mainly discusses the evolution mechanism of resource-based city shrinkage. A method involving the cross-correlation, partial-correlation, complex network analysis has been applied and taking Hegang as a case to study. The analysis demonstrates three outcomes. First, most of the correlations between resource dependence and other dimensional variables have no time delay. Hegang has formed a path dependence on resource-based industries. Second, there is no time delay between population loss and economic change. The real estate market is very sensitive to the perception of population loss and economic change. Third, market led public service facilities are more sensitive to the changes of other dimensional variables than government led public service facilities.
To begin with, many literatures have proposed that the process of urban shrinkage is very complex (Alves et al., 2016; Lin et al., 2017; Wolff and Wiechmann, 2018). A method is needed to capture and analyze the mechanism of urban shrinkage. There are few quantitative empirical studies on urban shrinkage mechanism, and there are still improvements to be made in the existing literatures. As Hartt pointed out in his research (Hartt, 2018a), there may be a risk of false negative results using the cross-correlation method solely. In order to explain the research results, Hartt relies on rich qualitative data to supplement the empirical results of cross-correlation analysis. Our findings agree with those reported by Hoekveld (2012) and Harrt (2018a), who used quantitative empirical methods to reveal the complexity of the process of urban shrinkage. In addition to applying the research methods of Hoekveld and Hartt to China’s resource-based shrinking cities, this paper also carries out corresponding improvements on the basis of Hartt. In order to reduce the risk of false negative results of cross-correlation analysis, we adopt partial-correlation method based on cross-correlation analysis. Our findings add to the accumulating evidence about the shrinkage mechanism of resource-based cities in China and provide insight into the complexity of shrinking city systems.
Furthermore, the results show the relation between mining industry and other dimension variables is very close and has time delay. In addition, Hegang has formed a path dependence on resource-based industries. From the formation process of cities, the determination of resource-based cities is undoubtedly closely related to resources. It is precisely because of its unique resource advantages that cities gradually rely on resources and continue to develop. From 2005 to 2012, with the increase of the production value of mining industry, the GDP per capita, local financial revenue and the proportion of the secondary industry also showed an upward trend. When the production value of mining industry began to decline from 2012, the GDP per capita, local financial revenue and the proportion of secondary industry showed a downward trend. For a long time, the secondary industry has become the main contributor to the economic development of Hegang. The greater the advantages of resource-based industries, the more concentrated the production factors such as capital and labor. Then there will be the problem of rigidity of industrial structure, resulting in path dependence and a trend of development along the original track (Miao et al., 2018). This is consistent with the existing research conclusions on resource-based shrinking cities (Tan et al., 2017; Wolff and Wiechmann, 2018). The difference is that most of the existing studies mainly reflected in policy research and qualitative analysis. Additionally, the results show that real estate market has a certain sensitivity to perceive population loss and economic change. Some studies also show that there is a significant correlation between the real estate market and economic growth (Wen and Zhao, 2007; Zhang, 2015). The actual situation is that the sales area of commercial housing in Hegang has been declining since 2010. The fundamental reason for the low sales of commercial housing is the population outflow caused by the weak economic growth. The massive loss of population will reduce the demand for house purchase, and the weak economic growth will reduce the purchasing power. Besides, results indicate that market led public service facilities are more sensitive to the changes of other dimensional variables than government led public service facilities. In theory, the continuous loss of population will reduce the scale of demand for urban public services. According to the research of Liu et al. (2020), urban shrinkage will inevitably lead to the decline of the total supply of urban public services, which is also in line with the laws of the market. When the government and market allocate public service facilities, there are great differences in the allocation of public services in different periods due to different subjects and discourse rights (Wang and Chang, 2019). Due to the profit seeking nature of the market, the flexibility in the allocation of public service facilities is higher, which is consistent with the reality.
Originally, urban shrinkage first sprouted in Germany. With the continuous advancement of urbanization, some cities in China have also experienced urban shrinkage. Especially in resource-based cities, with the depletion of resources, the phenomenon of urban shrinkage is becoming more and more obvious. In addition, urban growth is the main theme of urban development, and most existing policies are aimed at urban growth. From the rise of the industrial revolution, the rapid development of the world economy, the promotion of urbanization, to the global capital flow, all of them have greatly contributed to gather large number of people to urban agglomerations and developed areas. These phenomena have caused the population loss of some underdeveloped small and medium-sized cities. Even so, the academia and policy mainly regard urban shrinkage as a temporary and reversible phenomenon in the process of urban development, and are committed to restoring the growth of shrinking cities as soon as possible. However, the governance effect of shrinking cities is not significant, which is worthy of profound reflection. The phenomenon of urban shrinkage may be a structural long-term process prevalent in a wider space under the background of globalization (Wu and Qi, 2021). In the key construction tasks of new urbanization in 2019, China’s national development and Reform Commission proposed for the first time that ‘shrinking small and medium-sized cities should be downsized and strong, strictly control the increment and revitalize the stock’. In the key construction tasks of new urbanization and urban-rural integration development in 2020, China’s national development and Reform Commission once again emphasized ‘coordinating the cultivation of new cities and the slimming and strengthening of Shrinking Cities’, and put forward the idea of urbanization development with equal emphasis on growth and shrinkage. Therefore, without excessive pursuit of urban growth, a suitable path can be found by adapting to the development characteristics of the city itself. Under the premise of adjusting the economic structure and perfecting the market mechanism, resource-based cities should endeavor to solve the problem of overcapacity, and realize sustainable economic development. In addition, there are path dependence and strong uncertainty as well as internal and external factors overlap in urban development. It is important for decision makers to initiatively change urban shrinkage into an opportunity for smart growth and operation optimization.
-
This paper explores the evolution mechanism and complex pathways of population shrinkage of Hegang, a resource-based city in China. The results provide an empirical confirmation for the complexity of urban shrinkage process. Our results indicate that the variables of built environment dimension have more internal correlation. The variables in the dimensions of demographic profile, economic performance and industry structure are more externally related to the variables in other dimensions. The relation between mining industry and other dimension variables is very close and has about four to five years time delay. The development of Hegang has formed a path dependence on resource-based industries. Furthermore, population loss and economic change are interactive, and the real estate market has a certain sensitivity to perceive them. Besides, market led public service facilities are more sensitive to the changes of population outflow and economic recession than government led public service facilities.
This paper aims to contribute to following enquires. First, although relevant literatures recognize that urban shrinkage is a complex and multidimensional process, few studies have used empirical methods to reveal the trajectory of urban shrinkage. Furthermore, there are still improvements to be made in relevant empirical methods. This paper explores the evolution mechanism of urban shrinkage in Hegang through empirical analysis, which enriches the existing research. Second, because of its particularity in the urban system, resource-based cities are more likely to shrink due to their single industrial structure. Although literatures have paid attention to the problem of resource-based shrinking cities in China, it is mainly reflected in policy research and qualitative analysis. Empirical studies in related area are scare. Our study adds to the accumulating evidence about the shrinkage of resource-based cities.
As an important part of China’s urban system, resource-based cities’ shrinkage in China’s urbanization is not negligible. This paper provides a comprehensive analysis on the evolution mechanism of urban shrinkage in Hegang. However, there are still the following aspects that need to be further studied in the future. First, subjecting to data availability limitations, the indicators selected in this paper are not comprehensive enough. With the rapid development of remote sensing technology and intelligent algorithms, the selection of indicators can be refined in the future, and the combination of geographic data and various machine learning algorithms will be closer. Second, in the future it is possible to obtain a large range of spatiotemporal big data with high precision to represent human activities. In order to better formulate development strategies for specific shrinking cities, newer rational methods are needed to reveal and simulate the complexity of urban shrinkage process, and carry out the prediction and simulation analysis of relevant policies. Third, this paper studies the complex evolution path of resource-based shrinking city represented by Hegang. However, there are many resource-based cities in China. By applying empirical analysis to various kinds of shrinking cities, strong statistical evidence could provide important insight regarding the evolution of urban shrinkage. It is necessary to strengthen the in-depth research on the shrinkage of cities and regions of different types and sizes. With a better understanding of the interrelated processes of urban evolution, new policies for the sustainable development of shrinking cities can be explored.
-
Abstract: With the transformation of China’s industry and demographic structure, urban shrinkage, especially the resource-based cities due to their single industrial structure, tend to emerge gradually. Using empirical and quantitative methods, this paper explores the evolution mechanism of urban shrinkage in Hegang, a resource-based city in China. Our findings suggest that there are many correlations or cyclic relationships among variables, which provide an empirical confirmation for the complexity of urban shrinkage process. The result shows there is a time delay of about four to five years between the mining industry and the changes of demographic profile, economic performance and built environment variables. The development of Hegang has formed a path dependence on resource-based industries. Furthermore, the time lags between demographic profile and economic performance variables are not obvious, and the real estate market has a certain sensitivity to perceive population loss and economic change. Besides, market led public service facilities are more sensitive to the changes of population outflow and economic recession than government led public service facilities. The study findings could offer insights for other resource-based cities in developing countries to employ on the economic development policies issues.
-
Key words:
- urban shrinkage /
- resource-based cities /
- Hegang /
- complex pathways /
- China
-
Figure 4. Correlation network map of Hegang City, China. Meaning of EPOI and MPOI are same as Table 1. The number in the brackets denotes how many edges are connected to this particular variable
Figure 5. Dynamic variable relationships of key shrinkage variables for the a) production value of mining industry and b) resource dependence. Meaning of EPOI is same as Table 1
Figure 6. Dynamic variable relationships of key shrinkage variables for the a) GDP per capita and b) local financial revenue. Meaning of EPOI and MPOI are same as Table 1
Figure 7. Dynamic variable relationships of key shrinkage variables for the a) aging rate and b) resident population. Meaning of EPOI and MPOI are same as Table 1
Figure 8. Dynamic variable relationships of key shrinkage variables for the a) ratio of EPOIs and b) ratio of MPOIs. Meaning of EPOI and MPOI are same as Table 1
Figure 9. Dynamic variable relationships of key shrinkage variables for the a) per capita public green area and b) per capita road area. Meaning of EPOI and MPOI are same as Table 1
Figure 10. Dynamic variable relationships of key shrinkage variables for the sales area of commercial housing. Meaning of EPOI is same as Table 1
Figure 11. Complex correlations between variables. Different shading colors represent different variable types. the thick black line indicates the internal correlation between variables of the same type. The thin black line indicates the external correlation between different types of variables.
Figure 12. Trends of built environment variables of Hegang in 2005–2019. Meaning of EPOI and MPOI are same as Table 1.
Figure 13. Classification of variables related to key shrinkage variables. Meaning of EPOI and MPOI are same as Table 1. D: Demographic profile variables; E: Economic performance variables; I: Industry structure variables; B: Built environment variables
Figure 14. The process of urban shrinkage in Hegang City, China. The ‘||’ and one-way arrow represent that there is time delay in the relationship between the two variables, and the number represents the years of time delay. The two-way arrow indicates that there is no time delay in the relationship between the two variables
Table 1. List of include demographic profile, economic performance, industry structure and built environment variables to research population shrinkage of Hegang
Variable type Variable Unit Source Demographic profile Natural growth rate ‰ China City Statistical Yearbook Aging rate % Statistical Bulletin of National Economic and Social Development of Hegang City Dependency ratio % Resident population Ten thousand China Urban Construction Statistical Yearbook Economic performance GDP per capita Yuan (RMB) per person Heilongjiang Statistical Yearbook Local financial revenue Ten thousand yuan Hegang Statistical Yearbook Total fixed assets investment Hundred million yuan Heilongjiang Statistical Yearbook Foreign direct investment
Total retail sales of consumer goodsTen thousand yuan
Ten thousand yuanChina City Statistical Yearbook
China City Statistical YearbookUnemployment rate % Hegang Statistical Yearbook Industry structure Proportion of secondary industry % China City Statistical Yearbook Proportion of tertiary industry % China City Statistical Yearbook Resource dependence % China City Statistical Yearbook Production value of mining industry Ten thousand yuan Hegang Statistical Yearbook Built environment Per capita public green area
Per capita road aream2
m2Heilongjiang Statistical Yearbook
Heilongjiang Statistical YearbookSales area of commercial housing
Housing construction starts rate
Ratio of EPOIs
Ratio of MPOIskm2
%
%
%Hegang Statistical Yearbook
Hegang Statistical Yearbook
The AutoNavi
The AutoNaviMixed land use % The AutoNavi Notes: POI refers to Point of Interest. Ratio of EPOIs represents the ratio of the number of science, education and cultural service POIs to all POI quantities in this year. Ratio of MPOIs represents the ratio of the number of medical care services POIs to all POI quantities in this year. The data of aging rate and dependency ratio are from Economic and social development statistical bulletin of Hegang. The data collected annually over a span of 15 years from 2005 to 2019  下载: 导出CSV
-
[1] Alves D, Barreira A P, Guimaraes M H et al., 2016. Historical trajectories of currently shrinking Portuguese cities: a typology of urban shrinkage. Cities, 52: 20–29. doi: 10.1016/j.cities.2015.11.008 [2] Baccalá L A, Sameshima K, 2001. Overcoming the limitations of correlation analysis for many simultaneously processed neural structures. Progress in Brain Research, 130: 33–47. doi: 10.1016/S0079-6123(01)30004-3 [3] Billings S A, 2013. Nonlinear System Identification: NARMAX Methods in the Time, Frequency, and Spatio-Temporal Domains. Chichester: Wiley, 549–555. [4] Blanco H, Alberti M, Forsyth A et al., 2009. Hot, congested, crowded and diverse: emerging research agendas in planning. Progress in Planning, 71(4): 153–205. doi: 10.1016/j.progress.2009.03.001 [5] Bontje M, 2001. Dealing with deconcentration: population deconcentration and planning response in polynucleated urban regions in north-west Europe. Urban Studies, 38(4): 769–785. doi: 10.1080/00420980120035330 [6] Bontje M, 2004. Facing the challenge of shrinking cities in east Germany: the case of Leipzig. Geojournal, 61(1): 13–21. doi: 10.1007/s10708-005-0843-2 [7] Camarda D, Rotondo F, Selicato F, 2015. Strategies for dealing with urban shrinkage: issues and scenarios in Taranto. European Planning Studies, 23(1): 126–146. [8] Deng Yanru, Zhang Mingdou, 2020. Heterogeneous city shrinkage and urban public service level-Also on the regulatory role of Economic development level. Soft Science, 34(12): 96–103. (in Chinese) [9] Department of Urban Surveys of National Bureau of Statistics of China, 2006–2020. China City Statistical Yearbook. Beijing: China Statistics Press. (in Chinese) [10] Du Zhiwei, Li Xun, 2018. Characteristic and Mechanism of urban growth and shrinkage from demographic change perspective: a case study of Dongguan. Scientia Geographica Sinica, 38(11): 1837–1846. (in Chinese) [11] Du Z W, Jin L X, Ye Y Y et al., 2020a. Characteristics and influences of urban shrinkage in the Exo-urbanization area of the Pearl River Delta, China. Cities, 103: 102767. doi: 10.1016/j.cities.2020.102767 [12] Du Zhiwei, Jin Lixia, Zhang Hongou, 2020b. Planning response and implications for urban vacancy with the experience of smart shrinkage in Germany, America, and Japan. Urban Planning International, 35(2): 29–37. (in Chinese) [13] Feldhoff T, 2013. Shrinking communities in Japan: community ownership of assets as a development potential for rural Japan. URBAN DESIGN International, 18(1): 99–109. doi: 10.1057/udi.2012.26 [14] Forrester J W, 2003. Dynamic models of economic systems and industrial organizations. System Dynamics Review, 19(4): 329–345. doi: 10.1002/sdr.284 [15] Gatzweiler H P, Meyer K, Milbert A, 2003. Schrumpfende stäte in Deutschland? Fakten und trends. Informationen zur Rau mentwieklung, 11(24): 557–574. doi: 10.1007/BF03183060 [16] Gao Shuqi, Long Ying, 2017. Distinguishing and planning shrinking cities in northeast China. Planners, 33(1): 26–32. (in Chinese) [17] Guimaraes M H, Nunes L C, Barreira A P et al., 2016. What makes people stay in or leave shrinking cities? An empirical study from Portugal. European Planning Studies, 24(9): 1684–1708. doi: 10.1080/09654313.2016.1177492 [18] Guo Yuanyuan, Li Li, 2019. Change in the negative externality of the shrinking cities in China. Scientia Geographica Sinica, 39(1): 52–60. (in Chinese) [19] Haase A, Rink D, Grossmann K et al., 2014. Conceptualizing urban shrinkage. Environment and Planning A:Economy and Space, 46(7): 1519–1534. doi: 10.1068/a46269 [20] Haase A, Bernt M, Großmann K et al., 2016. Varieties of shrinkage in European cities. European Urban and Regional Studies, 23(1): 86–102. doi: 10.1177/0969776413481985 [21] Hartt M D, 2018a. How cities shrink: complex pathways to population decline. Cities, 75: 38–49. doi: 10.1016/j.cities.2016.12.005 [22] Hartt M D, 2018b. The diversity of north American shrinking cities. Urban Studies, 55(13): 2946–2959. doi: 10.1177/0042098017730013 [23] He S Y, Lee J, Zhou T et al., 2017. Shrinking cities and resource-based economy: the economic restructuring in China’s mining cities. Cities, 60: 75–83. doi: 10.1016/j.cities.2016.07.009 [24] Hegang Bureau of Statistics, 2006−2020. Hegang Statistical Yearbook. Beijing: China Statistics Press. (in Chinese) [25] Hegang Bureau of Statistics, 2005−2019. Statistical bulletin of national economic and social development of Hegang City, http://www.tjcn.org/tjgb/08hlj/946.html. Cited 8 September 2021. (in Chinese) [26] Hegang Municipal People’s Government. Main data bulletin of the seventh national census of Hegang City in 2020. Available at: www.hegang.gov.cn/xxgk_new/z_xgknr/z_xgjxx/z_xtjgb/2021/03/36138.htm. 2021-06-01 [27] Heilongjiang Bureau of Statistics, 2006–2020. Heilongjiang Statistical Yearbook. Beijing: China Statistics Press. (in Chinese) [28] Hoekveld J J, 2012. Time-space relations and the differences between shrinking regions. Built Environment, 38(2): 179–195. doi: 10.2148/benv.38.2.179 [29] Huang Weiting, 2014. Research on the shrinking cities in UK and the revelation to China. Planners, 30(S5): 205–209. (in Chinese) [30] Jiang Haining, Zhang Wenzhong, Yu Jianhui et al., 2020. Spatial coupling of innovative milieu and industrial structure transformation of resource-based cities in Shanxi province. Journal of Natural Resources, 35(2): 269–283. (in Chinese) [31] Jin Xianfeng, Dong Suocheng, Liu Wei et al., 2010. Study on relationship between industrial chain extension and evolution of resource-based City-A case study on Tongling City. Economic Geography, 30(3): 403–408. (in Chinese) [32] Khavarian-Garmsir A R, Pourahmad A, Hataminejad H et al., 2018. A comparative assessment of economic and physical inequality between shrinking and growing cities: a case study of Khuzestan province, Iran. International Journal of Urban Sciences, 22(1): 104–122. doi: 10.1080/12265934.2017.1358653 [33] Kim J M, Jung Y S, Choi T et al., 2011. Partial correlation with copula modeling. Computational Statistics & Data Analysis, 55(3): 1357–1366. doi: 10.1016/j.csda.2010.09.025 [34] Koster H R A, Rouwendal J, 2012. The impact of mixed land use on residential property values. Journal of Regional Science, 52(5): 733–761. doi: 10.1111/j.1467-9787.2012.00776.x [35] Lee J S, Won S, Kim S, 2016. Describing changes in the built environment of shrinking cities: case study of Incheon, south Korea. Journal of Urban Planning and Development, 142(2): 05015010. doi: 10.1061/(ASCE)UP.1943-5444.0000305 [36] Li B, Dewan H, 2017. Efficiency differences among China’s resource-based cities and their determinants. Resources Policy, 51: 31–38. doi: 10.1016/j.resourpol.2016.11.003 [37] Li He, Mykhnenko V, 2018. Urban shrinkage with Chinese characteristics. The Geographical Journal, 184(4): 398–412. doi: 10.1111/geoj.12266 [38] Li He, Kevin L, Zhang Pingyu, 2020. Population shrinkage in resource-dependent cities in China: processes, patterns and drivers. Chinese Geographical Science, 30(1): 1–15. doi: 10.1007/s11769-019-1077-4 [39] Li Hong, Zou Qing, 2018. Environmental regulations, resource endowments and urban industry transformation: comparative analysis of resource-based and non-resource-based cities. Economic Research Journal, 53(11): 182–198. (in Chinese) [40] Lin Xiongbin, Yang Jiawen, Zhang Xianchun et al., 2017. Measuring shrinking cities and influential factors in urban China: perspective of population and economy. Human Geography, 32(1): 82–89. (in Chinese) [41] Liu Chunyang, Yang Peifeng, 2017. A comparative study on the motivation mechanism and performance characteristics of Chinese and Foreign shrinking cities. Modern Urban Research, (3): 64–71. (in Chinese) [42] Liu Wenxin, Zhang Pingyu, Ma Yanji, 2007. Environmental effects of industrial structure evolution of resources-based city: a case study of Anshan city. Journal of Arid Land Resources and Environment, 21(2): 17–21. (in Chinese) [43] Liu X J, Long Y, 2016. Automated identification and characterization of parcels with OpenStreetMap and points of interest. Environment and Planning B:Planning and Design, 43(2): 341–360. [44] Liu Yubo, Li Jian, Xiao Suping et al., 2020. How does urban shrinkage affect the supply of local public services. Urban Development Studies, 27(7): 11–18. (in Chinese) [45] Long R Y, Chen H, Li H J et al., 2013. Selecting alternative industries for Chinese resource cities based on intra-and inter-regional comparative advantages. Energy Policy, 57: 82–88. doi: 10.1016/j.enpol.2012.10.047 [46] Long Ying, Wu Kang, Wang Jianghao, 2015. Shrinking Cities in China. Modern Urban Research, (9): 14–19. (in Chinese) [47] Long Y, Wu K, 2016. Shrinking cities in a rapidly urbanizing China. Environment and Planning A:Economy and Space, 48(2): 220–222. doi: 10.1177/0308518X15621631 [48] Mallach A, 2017. What we talk about when we talk about shrinking cities: the ambiguity of discourse and policy response in the United States. Cities, 69: 109–115. doi: 10.1016/j.cities.2017.01.008 [49] Meng Xiangfeng, Wang Dongyan, Li Hong, 2019. Correlation between urban shrink and urban compactness ratio in old industrial city: taking Siping city in Jilin province as an example. Economic Geography, 39(4): 67–74. (in Chinese) [50] Miao Changhong, Hu Zhiqiang, Geng Fengjuan et al., 2018. Characteristics of economic evolution and the influencing factors of resource-dependent cities in China: the role of path dependence, vulnerability and path creation. Geographical Research, 37(7): 1268–1281. (in Chinese) [51] Ministry of Housing and Urban-Rural Development of the People’s Republic of China, 2006−2020. China Urban Construction Statistical Yearbook. Beijing: China Statistics Press. (in Chinese) [52] Nefs M, Alves S, Zasada I et al., 2013. Shrinking cities as retirement cities? Opportunities for shrinking cities as green living environments for older individuals. Environment and planning A:Economy and Space, 45(6): 1455–1473. doi: 10.1068/a45302 [53] Park T, Shao X F, Yao S, 2015. Partial martingale difference correlation. Electronic Journal of Statistics, 9(1): 1492–1517. doi: 10.1214/15-EJS1047 [54] Reckien D, Martinez-Fernandez C, 2011. Why do cities shrink. European Planning Studies, 19(8): 1375–1397. doi: 10.1080/09654313.2011.593333 [55] Rieniets T, 2009. Shrinking cities: causes and effects of urban population losses in the twentieth century. Nature and Culture, 4(3): 231–254. doi: 10.3167/nc.2009.040302 [56] Saeed K, 2014. Jay Forrester’s operational approach to economics. System Dynamics Review, 30(4): 233–261. doi: 10.1002/sdr.1525 [57] Shao Peng, Wang Qi, Shan Yingji, 2020. Research on ecological protection and high quality development of Yellow River Basin based on text analysis. Journal of Arid Land Resources and Environment, 34(11): 78–83. (in Chinese) [58] Sousa S, Pinho P, 2015. Planning for shrinkage: paradox or paradigm. European Planning Studies, 23(1): 12–32. doi: 10.1080/09654313.2013.820082 [59] Sun Wei, Li Yang, Wang Dai et al., 2012. The efficiencies and their changes of China’s resources-based cities employing DEA and Malmquist index models. Journal of Geographical Science, 22(3): 509–520. doi: 10.1007/s11442-012-0943-0 [60] Sun Yang, Jiang Yuanxiang, Zhao Xiang et al., 2010. Survey on the research of network visualization. Computer Science, 37(2): 12–18,30. (in Chinese) [61] Tan Juntao, Zhang Pingyu, Lo K et al., 2017. Conceptualizing and measuring economic resilience of resource-based cities: case study of Northeast China. Chinese Geographical Science, 27(3): 471–481. doi: 10.1007/s11769-017-0878-6 [62] Vargha A, Bergman L R, Delaney H D, 2013. Interpretation problems of the partial correlation with nonnormally distributed variables. Quality & Quantity, 47(6): 3391–3402. doi: 10.1007/s11135-012-9727-y [63] Wang Changjun, Qu Yangyang, Wu Xiangli, 2019. A study on economic-population contraction governance in resource-exhausted cities: a realistic analysis based on resource-exhausted cities in Heilongjiang Province. Macroeconomics, (8): 156–169. (in Chinese) [64] Wang Jie, Ye Jianping, 2020. Population and housing market in shrinking cities with declining industries: based on analysis in Dongguan City. Urban Problems, (6): 56–63. (in Chinese) [65] Wang Lucang, Chang Fei, 2019. Public service facilities configuration and planning based on multi-source data, Lanzhou. Planners, 35(18): 12–18. (in Chinese) [66] Wen Jun, Zhao Xufeng, 2007. The relationship between China’s stock market, real estate market and economic growth. Statistics & Decision, (20): 90–92. (in Chinese) [67] Wiechmann T, Pallagst K M, 2012. Urban shrinkage in Germany and the USA: a comparison of transformation patterns and local strategies. International Journal of Urban and Regional Research, 36(2): 261–280. doi: 10.1111/j.1468-2427.2011.01095.x [68] Wolff M, Wiechmann T, 2018. Urban growth and decline: Europe’s shrinking cities in a comparative perspective 1990–2010. European Urban and Regional Studies, 25(2): 122–139. doi: 10.1177/0969776417694680 [69] Wu Kang, Long Ying, Yang Yu, 2015. Urban shrinkage in the Beijing-Tianjin-Hebei region and Yangtze River delta: pattern, trajectory and factors. Modern Urban Research, (9): 26–35. (in Chinese) [70] Wu Kang, Sun Dongqi, 2017. Progress in urban shrinkage research. Economic Geography, 37(11): 59–67. (in Chinese) [71] Wu Kang, Qi Wei, 2021. Shrinking cities: misunderstandings, identifications and reflections. Geographical Research, 40(1): 213–229. (in Chinese) [72] Wu K, Wang X N, 2020. Understanding growth and shrinkage phenomena of industrial and trade cities in southeastern China: case study of Yiwu. Journal of Urban Planning and Development, 146(4): 05020028. doi: 10.1061/(ASCE)UP.1943-5444.0000628 [73] Wu K, Yao C C, 2021. Exploring the association between shrinking cities and the loss of external investment: an intercity network analysis. Cities, 119: 103351. doi: 10.1016/j.cities.2021.103351 [74] Xie Yuantao, Li Hong, Zou Qing, 2017. A study on the innovation index of resource-based cities in China: taking 116 cities at the prefecture level for example. Journal of Peking University (Philosophy & Social Sciences), 54(5): 146–158. (in Chinese) [75] Xu Bo, Pang Deliang, 2014. Growth and decline: a study on the international urban shrinkage and its enlightenment to China. Economist, (4): 5–13. (in Chinese) [76] Yang Dongfeng, Long Ying, Yang Wenshi et al., 2015. Losing population with expanding space: paradox of urban shrinkage in China. Modern Urban Research, (9): 20–25. (in Chinese) [77] Yang W, Jiang X L, 2018. Evaluating sustainable urbanization of resource-based cities based on the Mckinsey matrix: case study in China. Journal of Urban Planning and Development, 144(1): 05017020. doi: 10.1061/(ASCE)UP.1943-5444.0000423 [78] Yang Y, Yan Z, Yeh A G O et al., 2017. Measurements of POI-based mixed use and their relationships with neighbourhood vibrancy. International Journal of Geographical Information Science, 31(4): 658–675. doi: 10.1080/13658816.2016.1220561 [79] Yang Z S, Dunford M, 2018. City shrinkage in China: scalar processes of urban and hukou population losses. Regional Studies, 52(8): 1111–1121. doi: 10.1080/00343404.2017.1335865 [80] Yu Binbin, 2015. Economic growth effects of industrial restructuring and productivity improvement: analysis of dynamic spatial panel model with Chinese city data. China Industrial Economics, (12): 83–98. (in Chinese) [81] Yu C, De Jong M, Cheng B D, 2016. Getting depleted resource-based cities back on their feet again: the example of Yichun in China. Journal of Cleaner Production, 134: 42–50. doi: 10.1016/j.jclepro.2015.09.101 [82] Yu Jianhui, Zhang Wenzhong, Wang Dai et al., 2013. The effect of resource-exhausted city transformation. Resources Science, 35(9): 1812–1820. (in Chinese) [83] Zhang Cheng, Cai Wanhuan, Yu Tongshen, 2013. Regional economic development and carbon productivity——a convergent and decoupling index analysis. China Industrial Economics, (5): 18–30. (in Chinese) [84] Zhang Jie, Guo Cheng, 2016. Dealing with shrinking city in Germany: a case of Leipzig. Modern Urban Research, (2): 11–16. (in Chinese) [85] Zhang Xueliang, Zhang Mingdou, Xiao Hang, 2018. Study on spatial pattern and formation mechanism of urban contraction in Chengdu-Chongqing city cluster. Journal of Chongqing University (Social Science Edition), 24(6): 1–14. (in Chinese) [86] Zhang Yong, 2015. Will the real estate market crush China: a Study on the dynamic relationship between real estate market, money market fluctuation and economic fluctuation. Public Finance Research, (9): 8–22. (in Chinese) [87] Zhong Shaoying, Yang Xin, Chen Rui, 2016. The accessibility measurement of hierarchy public service facilities based on multi-mode network dataset and the two-step 2SFCA: a case study of Beijing’s medical facilities. Geographical Research, 35(4): 731–744. (in Chinese) [88] Zhou Kai, Qian Fangfang, Yan Yan, 2017. A multi-scaled analysis of the ‘Shrinking Map’ of the population in Hunan province. Geographical Research, 36(2): 267–280. (in Chinese) -

 点击查看大图

计量
- 文章访问数: 793
- HTML全文浏览量: 381
- PDF下载量: 62
- 被引次数: 0


