


-
The Sichuan Basin (SCB) urban agglomeration is a first-class city group in China, with a congested population, densely populated towns, and surrounded by mountains terrain and long-term stagnant meteorological conditions (Miao et al., 2019). In recent decades, the SCB has suffered from severe atmospheric pollution and frequent haze events (Liao et al., 2017; Ning et al., 2018) as a result of increased pollutant emissions, high population density, and extensive human activities that have accompanied the rapid industrialization and urbanization of the country (Tiwari et al., 2015; Sarkodie et al., 2020). The SCB has been recognized as having the following problems: first, its air quality is negatively impacted, which in turn affects people’s health (Shaffer et al., 2019; Tainio et al., 2021), increasing the risk of death (Maji et al., 2017; Wyatt et al., 2020; Yin et al., 2020); second, visibility is reduced (Park et al., 2006; Liu et al., 2019a), which hinders travel and affects traffic safety (Fu et al., 2014; Sun et al., 2014); third, the development of the regional economy is inhibited (Lanzi and Dellink, 2019); and fourth, significant changes in weather (Knippertz et al., 2015) and climate systems occur due to aerosol radiation interaction and aerosol-cloud interaction (Coakley and Cess, 1985; Rosenfeld et al., 2014; Fan et al., 2016; Guo et al., 2016; 2017b; San José et al., 2018). Information on the spatio-temporal evolution of atmospheric pollution and the potential formation mechanisms of haze events across different seasons in the SCB is required to assess sustainable economic development and the effectiveness of pollution control measures.
At present, many studies in China have understandably focused on the main economic centers, such as the Beijing-Tianjin-Hebei region (Zhang et al., 2016; Bei et al., 2020), the Yangtze River Delta region (Zhu et al., 2018; Liu et al. 2019b), and the Pearl River Delta region (Li et al., 2018; Chen et al., 2019). In comparison, there have been relatively few studies on haze events in regions with complex terrain such as basins and mountains, for instance, the SCB (Tao et al., 2013; Li et al., 2017; Luo et al., 2020), and most of them have shown that events are closely linked to certain seasons (Huang et al., 2018; Wu et al., 2019), and cities (Wang et al., 2018a). In Western Europe and North America have a few studies in cities with terrain such as basins and mountains, such as Salt Lake City, Mexico City and Los Ange-les (Langford et al., 2010; Whiteman et al., 2014; Calderon-garciduenas et al., 2015), and major cities in the Mediterranean Basin (Kanakidou et al., 2011).
Previous studies had a small spatial extent and short temporal frame, and the main analysis method used was the examination of the physical and chemical composition of the polluted gas. Therefore, fully understanding the spatio-temporal characteristics of air pollution and the causes of haze events in the entire SCB has not been possible. To fill these gaps, Inspired by many pioneering studies (e.g., Jacob and Winner, 2009; Guo et al., 2010; Bressi et al., 2013; Fu and Pan 2016; Lee et al., 2019), we integrated multi-source data and trajectory models for research and analysis. Ground-monitored atmospheric data and satellite data are the most accurate publicly available data sources and have the largest spatio-temporal coverage, such that they can be used for global, national, and regional-scale studies. Here, we used the following data to characterize the long-term variations and trends in atmospheric pollution and explore the possible potential cause of haze events in different seasons: air quality and six standard air pollutant data from ground monitoring at sites in 17 cities in the SCB from 2015–2018, satellite data (fire point data, aerosol subtype, aerosol optical depth (AOD)), backward trajectories, meteorological data, and planetary boundary layer height (PBLH). The objective of this study was to scientifically analyze the spatio-temporal characteristics of atmospheric pollution, pollution sources, and the causes of haze events in SCB, China, and to explore the mechanisms involved in the formation of different seasons haze events in complex terrain such as basins and mountains, and to provide scientific insights for other countries or regions in the study of air pollution in similar terrain.
-
The SCB (27°50′N–32°40′N, 102°00′E–108°08′E) in southwest China consists of 17 cities and is surrounded by mountains and plateaus at an altitude of 2000–3000 m, with the Daba Mountains to the north, the Songpan Plateau to the west, the Daliang Mountains to the south, and the Wu Mountains and Yun-Gui Plateau to the east (Fig. 1). The climate is characterized by a subtropical monsoon humid climate, with an average temperature of 24–28℃ in summer and 4–8℃ in winter. The annual relative humidity was higher, with an average of 82% in 2016 (Huang et al., 2018) and 77% in 2017.

Figure 1. Regional topography and atmospheric monitoring sites in the Sichuan Basin (SCB), China
-
Ground-monitored daily average air quality index (AQI) values and standard atmospheric pollutant (i.e., PM10, PM2.5, O3, SO2, NO2, and CO) concentrations in 17 cities from 2015–2018 were obtained from the National Urban Air Quality Real-time Publishing Platform (
http://106.37.208.233:20035/ ) (Wei et al., 2018) (Fig. 1). There were 93 monitoring sites for atmospheric pollutants in total. The daily average AQI values and atmospheric pollutant concentrations at all sites in the city were used to represent the daily value of the city. The average value of the cities was used to represent the value of the SCB, and the seasonal value was the average value of the season (spring: March–May; summer: June–August; autumn: September–November; and winter: January, February, and December). Seasonal AQI values for all cities from 2015 to 2018 were spatially interpolated to provide the spatio-temporal distribution of air quality for the SCB using the inverse distance weighted interpolation method. Daily AQI values in each city were used to analyze the variation trends in air quality from 2015–2018 in the SCB. Daily standard atmospheric pollutant concentrations for all cities in 2017 were provided to detail variations in atmospheric pollutant concentrations in the SCB by statistical analysis. -
Fire point data were obtained from the Fire Information for Resource Management System (FIRMS) (
https://firms.modaps.eosdis.nasa.gov/download/request.php ), which was processed by the Moderate Resolution Imaging Spectroradiometer (MODIS) Terra and Aqua (Kaufman et al., 1998; Schroeder et al., 2014). The fire points were used to analyze the situation and spatio-temporal variations in biological combustion during each season (Ke et al., 2019). -
AOD data were obtained from the Modern-Era Retrospective analysis for Research and Applications, Version 2 (MERRA-2), data from the National Aeronautics and Space Administration (NASA) (Yang et al., 2020) (
https://disc.gsfc.nasa.gov ). High-resolution aerosol subtypes were provided by Cloud-Aerosol Lidar and Infrared Pathfinder Satellite Observations (CALIPSO) (https://www-calipso.larc.nasa.gov ), and were divided into six types: clean marine, dust, polluted continental, clean continental, polluted dust, and smoke based on the height, location, type, extinction coefficient, and radar color ratio of the aerosols (Mielonen et al., 2009; Burton et al., 2013).The AOD reflected the values of aerosol longitudinal growth and reflected pollution levels. Aerosol subtypes reflected the specific composition of aerosols in detail. During different haze periods, the aerosol subtype data from CALIPSO were collected when the satellite passed over the SCB. These data enabled the identification of major and possible emissions sources, combined with the ground monitoring data for atmospheric pollutants.
-
Meteorological data mainly included wind speed (WS), relative humidity (RH), and temperature. The RH and temperature data were obtained from the China Meteorological Data Service Center (Ying et al., 2014) (
http://data.cma.cn ). The WS was obtained from the National Environmental Prediction Center (NCEP) (Kalnay et al., 1996) (http://www.esrl.noaa.gov ). The PBLH was obtained from the European Center for Medium-Range Weather Forecasts (ECMWF) (Molteni et al., 1996) (https://apps.ecmwf.int/datasets ). -
In this study, the independent sample t-test was used to determine the difference in the mean values of the AQI, PM2.5, PM10, and other atmospheric pollutants and meteorological data, with a confidence of 95%.
-
Pearson correlations (Rodgers and Nicewander, 1988) were obtained for the relations between the AQI at monthly scales as follows:
$${R_{{{xy}}}}{\rm{ = }}\frac{{\displaystyle\sum\limits_{i = 1}^n {[({x_i} - \bar x)({y_i} - \bar y)]} }}{{\sqrt {\displaystyle\sum\limits_{i = 1}^n {{{({x_i} - \bar x)}^2}} } \sqrt {\displaystyle\sum\limits_{i = 1}^n {{{({y_i} - \bar y)}^2}} } }}$$ (1) where Rxy is the linear correlation coefficient of the x and y variables, xi and yi are the AQI values of the city at site i of the x and y variables, respectively,
$\bar x$ and$\bar y$ are the annual and monthly AQI values of the cities, respectively, and n is the number of cities. The significance test of the related coefficient was completed by a t-test. -
Inverse distance weighted is a widely used interpolation algorithm, which mainly uses a combination of eight linear points from a set of sampling points to determine pixel values (Shepard, 1968) as follows:
$${Z_0} = \frac{{{H_i}^{ - p}{Z_i}}}{{\displaystyle\sum\limits_{i = 1}^n {{H_i}^{ - p}} }}$$ (2) where Z0 is the estimated value; Zi is the attribute value of the i-th (i = 1, 2, 3... n) sample point; p is the weighted index, which significantly affects the interpolation results; and Hi is the distance.
Previous studies (Zhang et al., 2012) have shown that the best number of search sample points are 8–12 points and the best-weighted index is 2 or 3. The inverse distance weighted parameters for 12 search sample points and a weighted index of 2 were used to analyze the spatio-temporal variation in the AQI, WS, and RH in this study.
-
ArcGIS10.2 was adopted to carry out spatial coordinate conversion, registration, and clipping of the satellite remote sensing data. For the different spatial resolution remote sensing data, the first step was administrative region clipping; the array data were then masked using polygons in Python, and the statistical values of the polygons were obtained using the masked array in Python to calculate the average value of each city in the SCB. Remote sensing data with different time resolutions were also converted into daily average values. After processing these data, they were used in the interpolation operation.
-
To investigate the transport characteristics of the air mass trajectory, backward trajectories in provincial capitals (Chengdu) were used to analyze the causes of haze events in the SCB. In this study, 5-d backward trajectories arriving at the Chengdu site with a starting height of 500, 1000, and 1500 m were calculated using the Hybrid Single-Particle Lagrangian Integrated Trajectory (HYSPLIT4.9) model (Stein et al., 2015) for different haze periods. NCEP GDAS (National Centers for Environmental Prediction Global Data Assimilation System) data were used as meteorological inputs for the HYSPLIT model (Ma et al., 2017).
-
According to the AQI value, air quality can be classified into six levels: Excellent (0–50), Good (51–100), Lightly polluted (101–150), Moderately polluted (151–200), Heavily polluted (201–300), and Severely polluted (> 300) (MEP, 2012). In this study, the pollution days were classified as AQI > 100. From Table 1, we can observe that the mean annual AQI value increased between 2015 and 2016, decreased since 2017, and the air quality significantly improved in 2018. Annual pollution days increased by 16.28% from 2015 to 2016, decreased by 11.00% from 2016 to 2017, and decreased by 38.20% from 2017 to 2018. The percentages of annual pollution days in winter from 2015 to 2018 were 53.49%, 49.00%, 55.06%, and 54.55%, respectively. The percentages of annual pollution days in spring from 2015 to 2018 were 23.25%, 20.00%, 17.98%, and 21.81%, respectively. The percentages of annual pollution days in summer from 2015 to 2018 were 11.63%, 13.00%, 16.85%, and 14.55%, respectively. In autumn, from 2015 to 2018, the total annual pollution days accounted for 11.63%, 18.00%, 10.11%, and 9.09%, respectively. On a seasonal scale, the AQI values and air pollution levels in the SCB followed the order of winter > spring > summer > autumn. On an annual scale, the AQI values and air pollution levels in the SCB followed the order of 2016 > 2015 > 2017 > 2018.
Table 1. Annual average air quality index (AQI) value, seasonal average AQI value, and pollution days in the Sichuan Basin (SCB), China, from 2015–2018
Year AQI-Y AQI-MAM AQI-JJA AQI-SON AQI-DJF PDY PDMAM PDJJA PDSON PDDJF 2015 82.18±3.78 79.94±3.52 70.06±3.97 64.90±4.21 113.84±8.75 86±26 20±6 10±6 10±5 46±9 2016 82.73±3.18 77.79±4.23 69.79±4.19 74.02±5.41 109.31±5.24 100±24 20±6 13±5 18±6 49±7 2017 80.71±3.87 74.54±3.04 73.34±4.10 58.68±4.90 116.29±7.31 89±21 16±5 15±6 9±5 49±7 2018 68.98±2.36 70.57±2.72 61.60±2.98 54.97±3.33 88.77±3.86 55±18 12±4 8±4 5±4 30±6 Notes: Annual average air quality index value (AQI-Y); Spring average air quality index (AQI-MAM); Summer average air quality index (AQI-JJA); Autumn average air quality index (AQI-SON); Winter average air quality index (AQI-DJF); Annual average pollution days (PDY); Spring average pollution days (PDMAM); Summer average pollution days (PDJJA); Autumn average pollution days (PDSON); and Winter average pollution days (PDDJF). -
The average AQI values during winter in 2015, 2016, and 2017 were higher (Table 1). In winters of 2015, 2016, 2017, and 2018, an AQI value greater than 100 was found in 14, 13, 13, and 2 cities, respectively (Fig. 2). These results showed a notable decrease in the AQI in the winter of 2018 (Fig. 2; 2018-DJF).

Figure 2. The spatio-temporal variation in the air quality index (AQI) by season in the Sichuan Basin (SCB), China in 2015–2018. MAM, spring: March–May; JJA, summer: June–August; SON, autumn: September–November; and DJF, winter: January, February, and December
Compared to 2015, the average AQI during spring in 2016, 2017, and 2018 decreased by 2.69%, 6.76%, and 11.72%, respectively (Table 1). The number of cities with AQI values less than 80 in 2015, 2016, 2017, and 2018 was 8, 10, 12, and 14, respectively (Fig. 2). In 2018, the air quality improved significantly (Fig. 2; 2018-MAM).
From 2015 to 2018, in summer, the number of cities with AQI values less than 70 in 2015, 2016, 2017, and 2018 was 10, 8, 5, and 15, respectively (Fig. 2). Air pollution was highest in the summer of 2017 (Fig. 2; 2017-JJA).
In the autumn of 2016, the AQI value was relatively high, worse than that in 2015, 2017, and 2018. In 2015 and 2017, the autumn AQI of all cities was lower than 80, while in 2018, the autumn AQI of all cities was lower than 70.
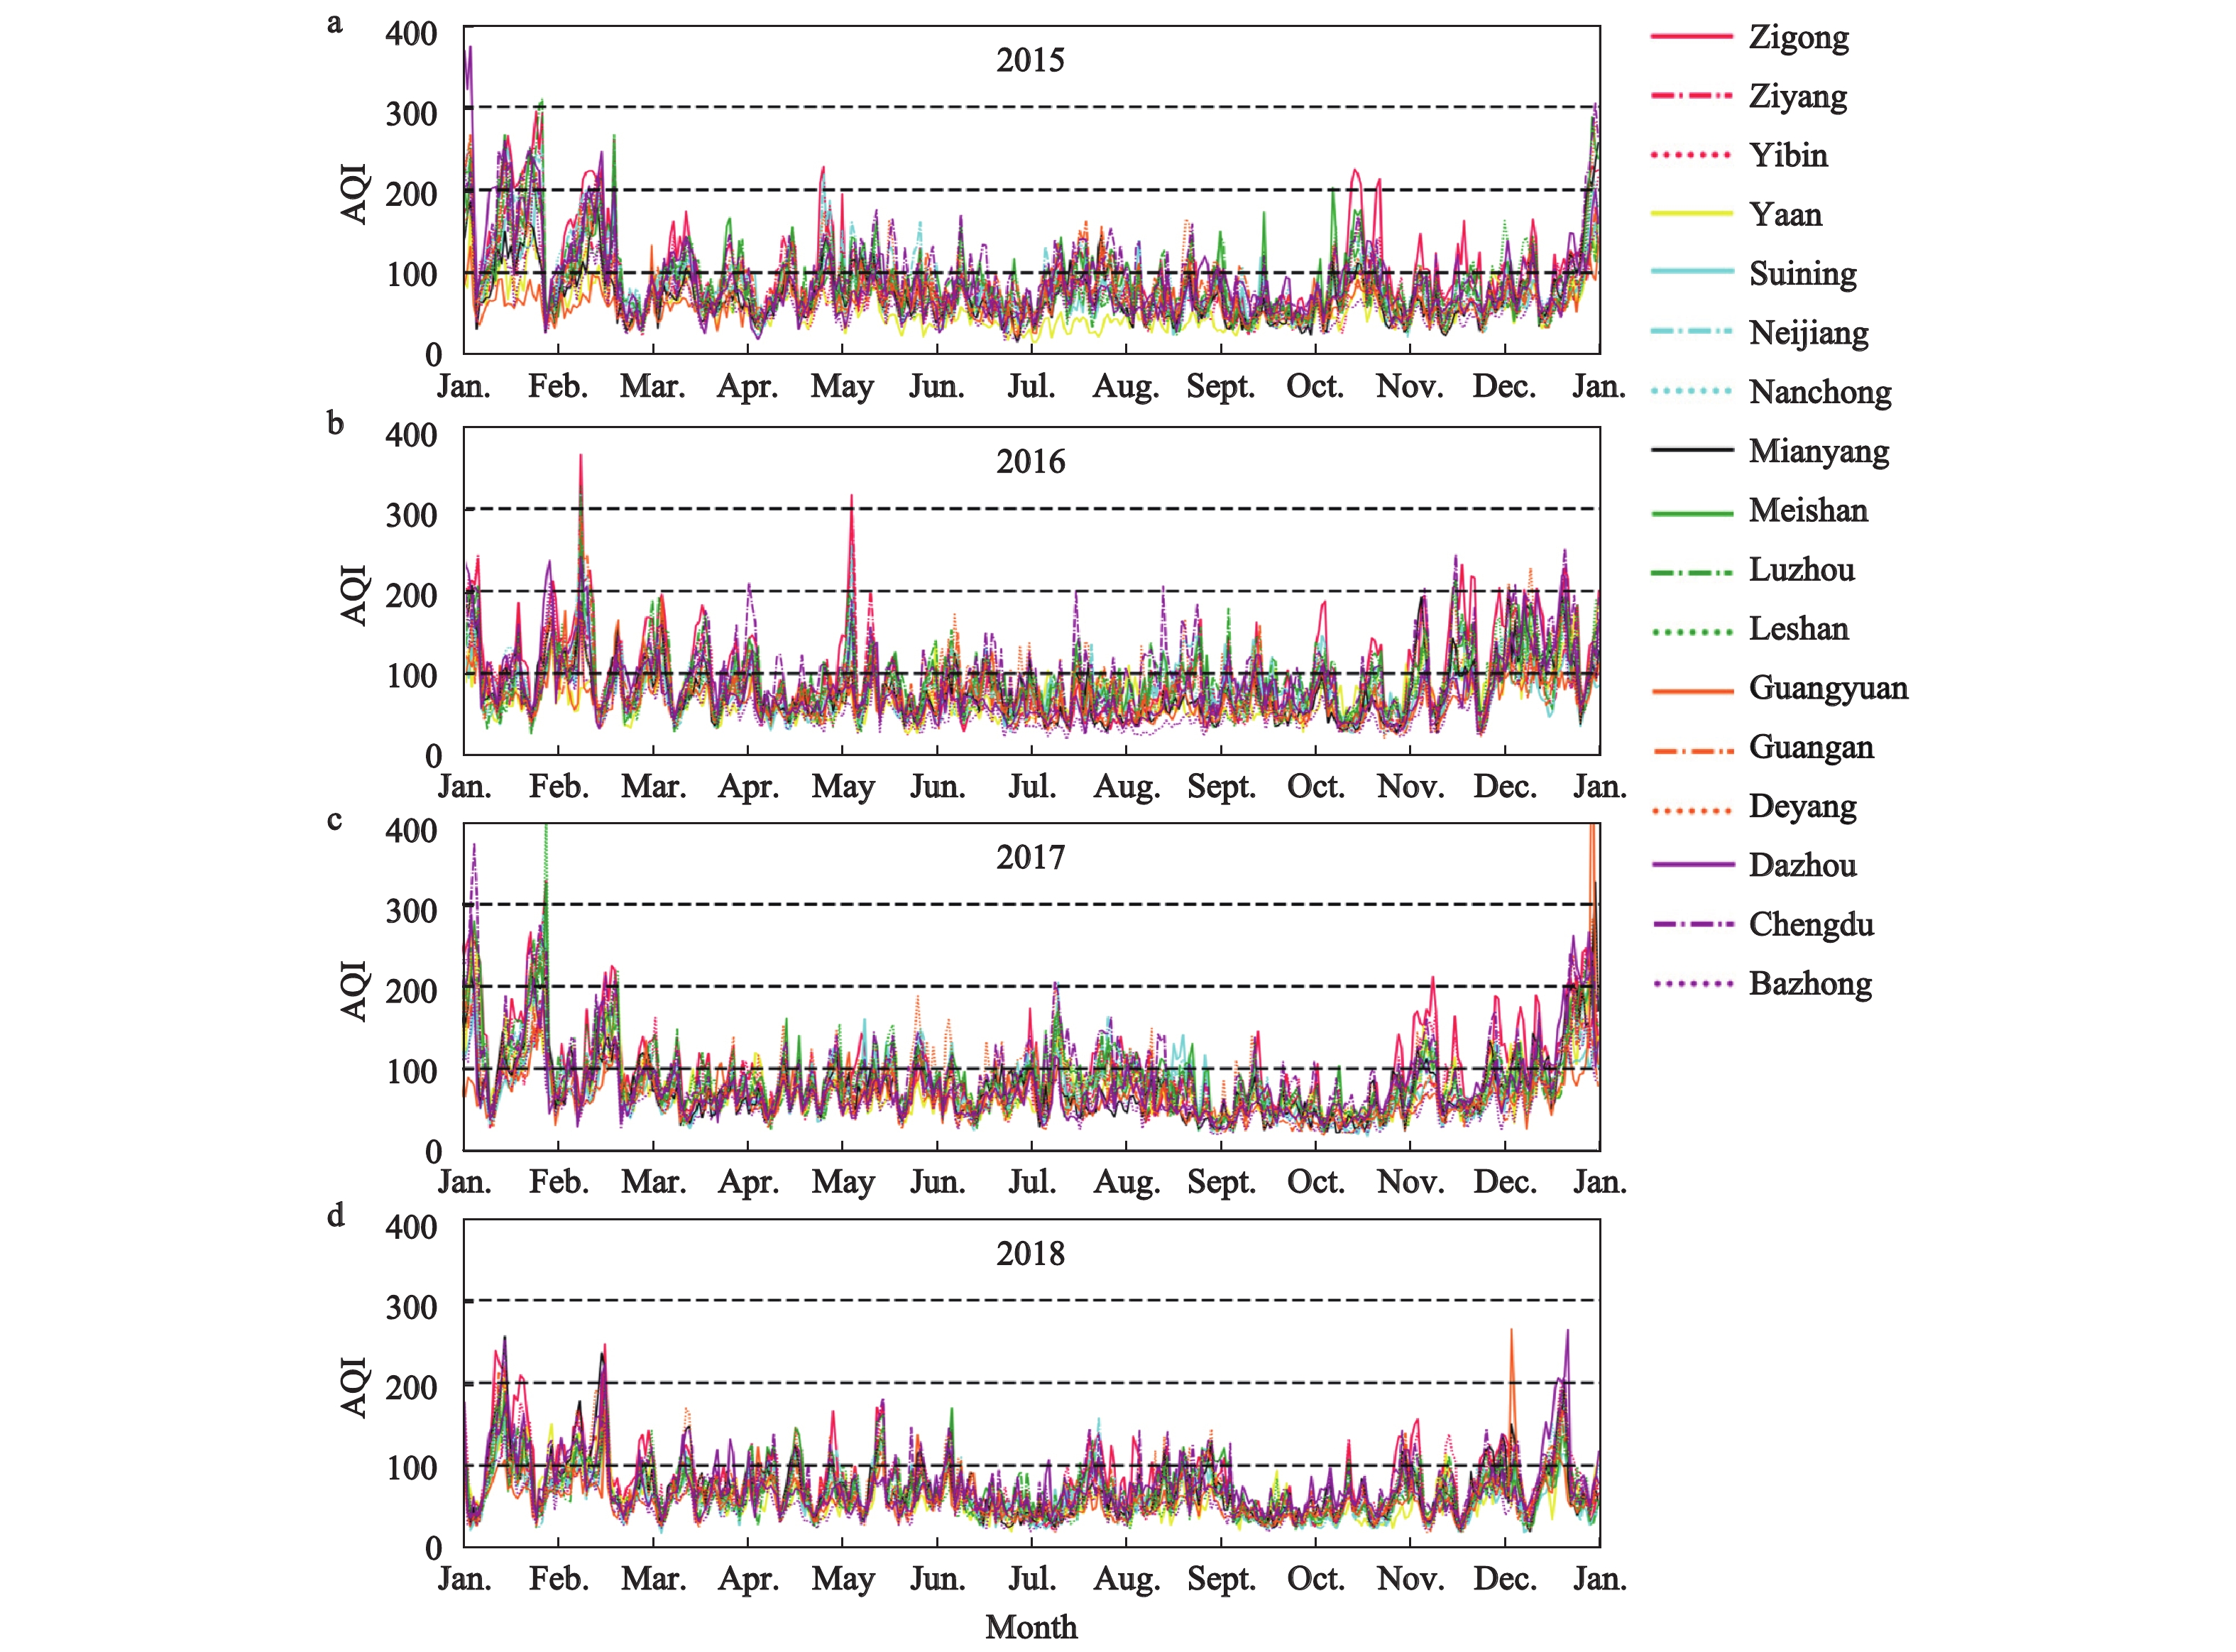
According to the data analysis in Table 2 and Figs. 3 and 4, most of the pollution days occurred in January, February, March, April, May, July, October, and December in 2015. In 2016, most of the pollution occurred in January, February, March, May, June, August, November, and December. In 2017, most of the pollution occurred in January, February, May, July, November, and December. In 2018, most of the pollution occurred in January, February, April, May, August, November, and December. Comparing the data across the four years, four typical periods when air pollution occurred were identified in the SCB. Pollution in winter was the most severe and persistent, especially in January. Spring was also a period of frequent pollution, especially in May. In summer, pollution was likely to occur in July, whereas in autumn was likely to occur in November.
Table 2. Monthly average air quality index (AQI) value and pollution days in the Sichuan Basin (SCB), China from 2015–2018
Year Variable Jan. Feb. Mar. Apr. May Jun. Jul. Aug. Sep. Oct. Nov. Dec. 2015 AQI 141.05 105.75 81.91 77.40 80.50 63.26 78.24 68.68 53.34 76.73 64.63 94.73 Days 21 14 7 7 6 1 6 3 1 7 2 11 2016 AQI 104.58 102.60 87.93 67.90 77.53 73.59 64.62 71.16 67.38 63.26 91.42 120.76 Days 14 14 10 3 7 5 3 5 3 4 11 21 2017 AQI 133.88 95.54 71.36 69.78 82.48 68.11 83.80 68.10 52.36 46.59 77.10 119.47 Days 20 11 4 3 9 2 9 4 1 1 7 18 2018 AQI 92.96 92.40 68.54 71.79 71.37 59.05 56.12 69.62 45.02 53.77 66.13 80.95 Days 12 10 3 5 4 2 2 4 1 1 3 8 
Figure 3. Air quality index (AQI) daily variation in 17 cities across the Sichuan Basin (SCB), China

Figure 4. Monthly pollution days in 17 cities across the Sichuan Basin (SCB), China
-
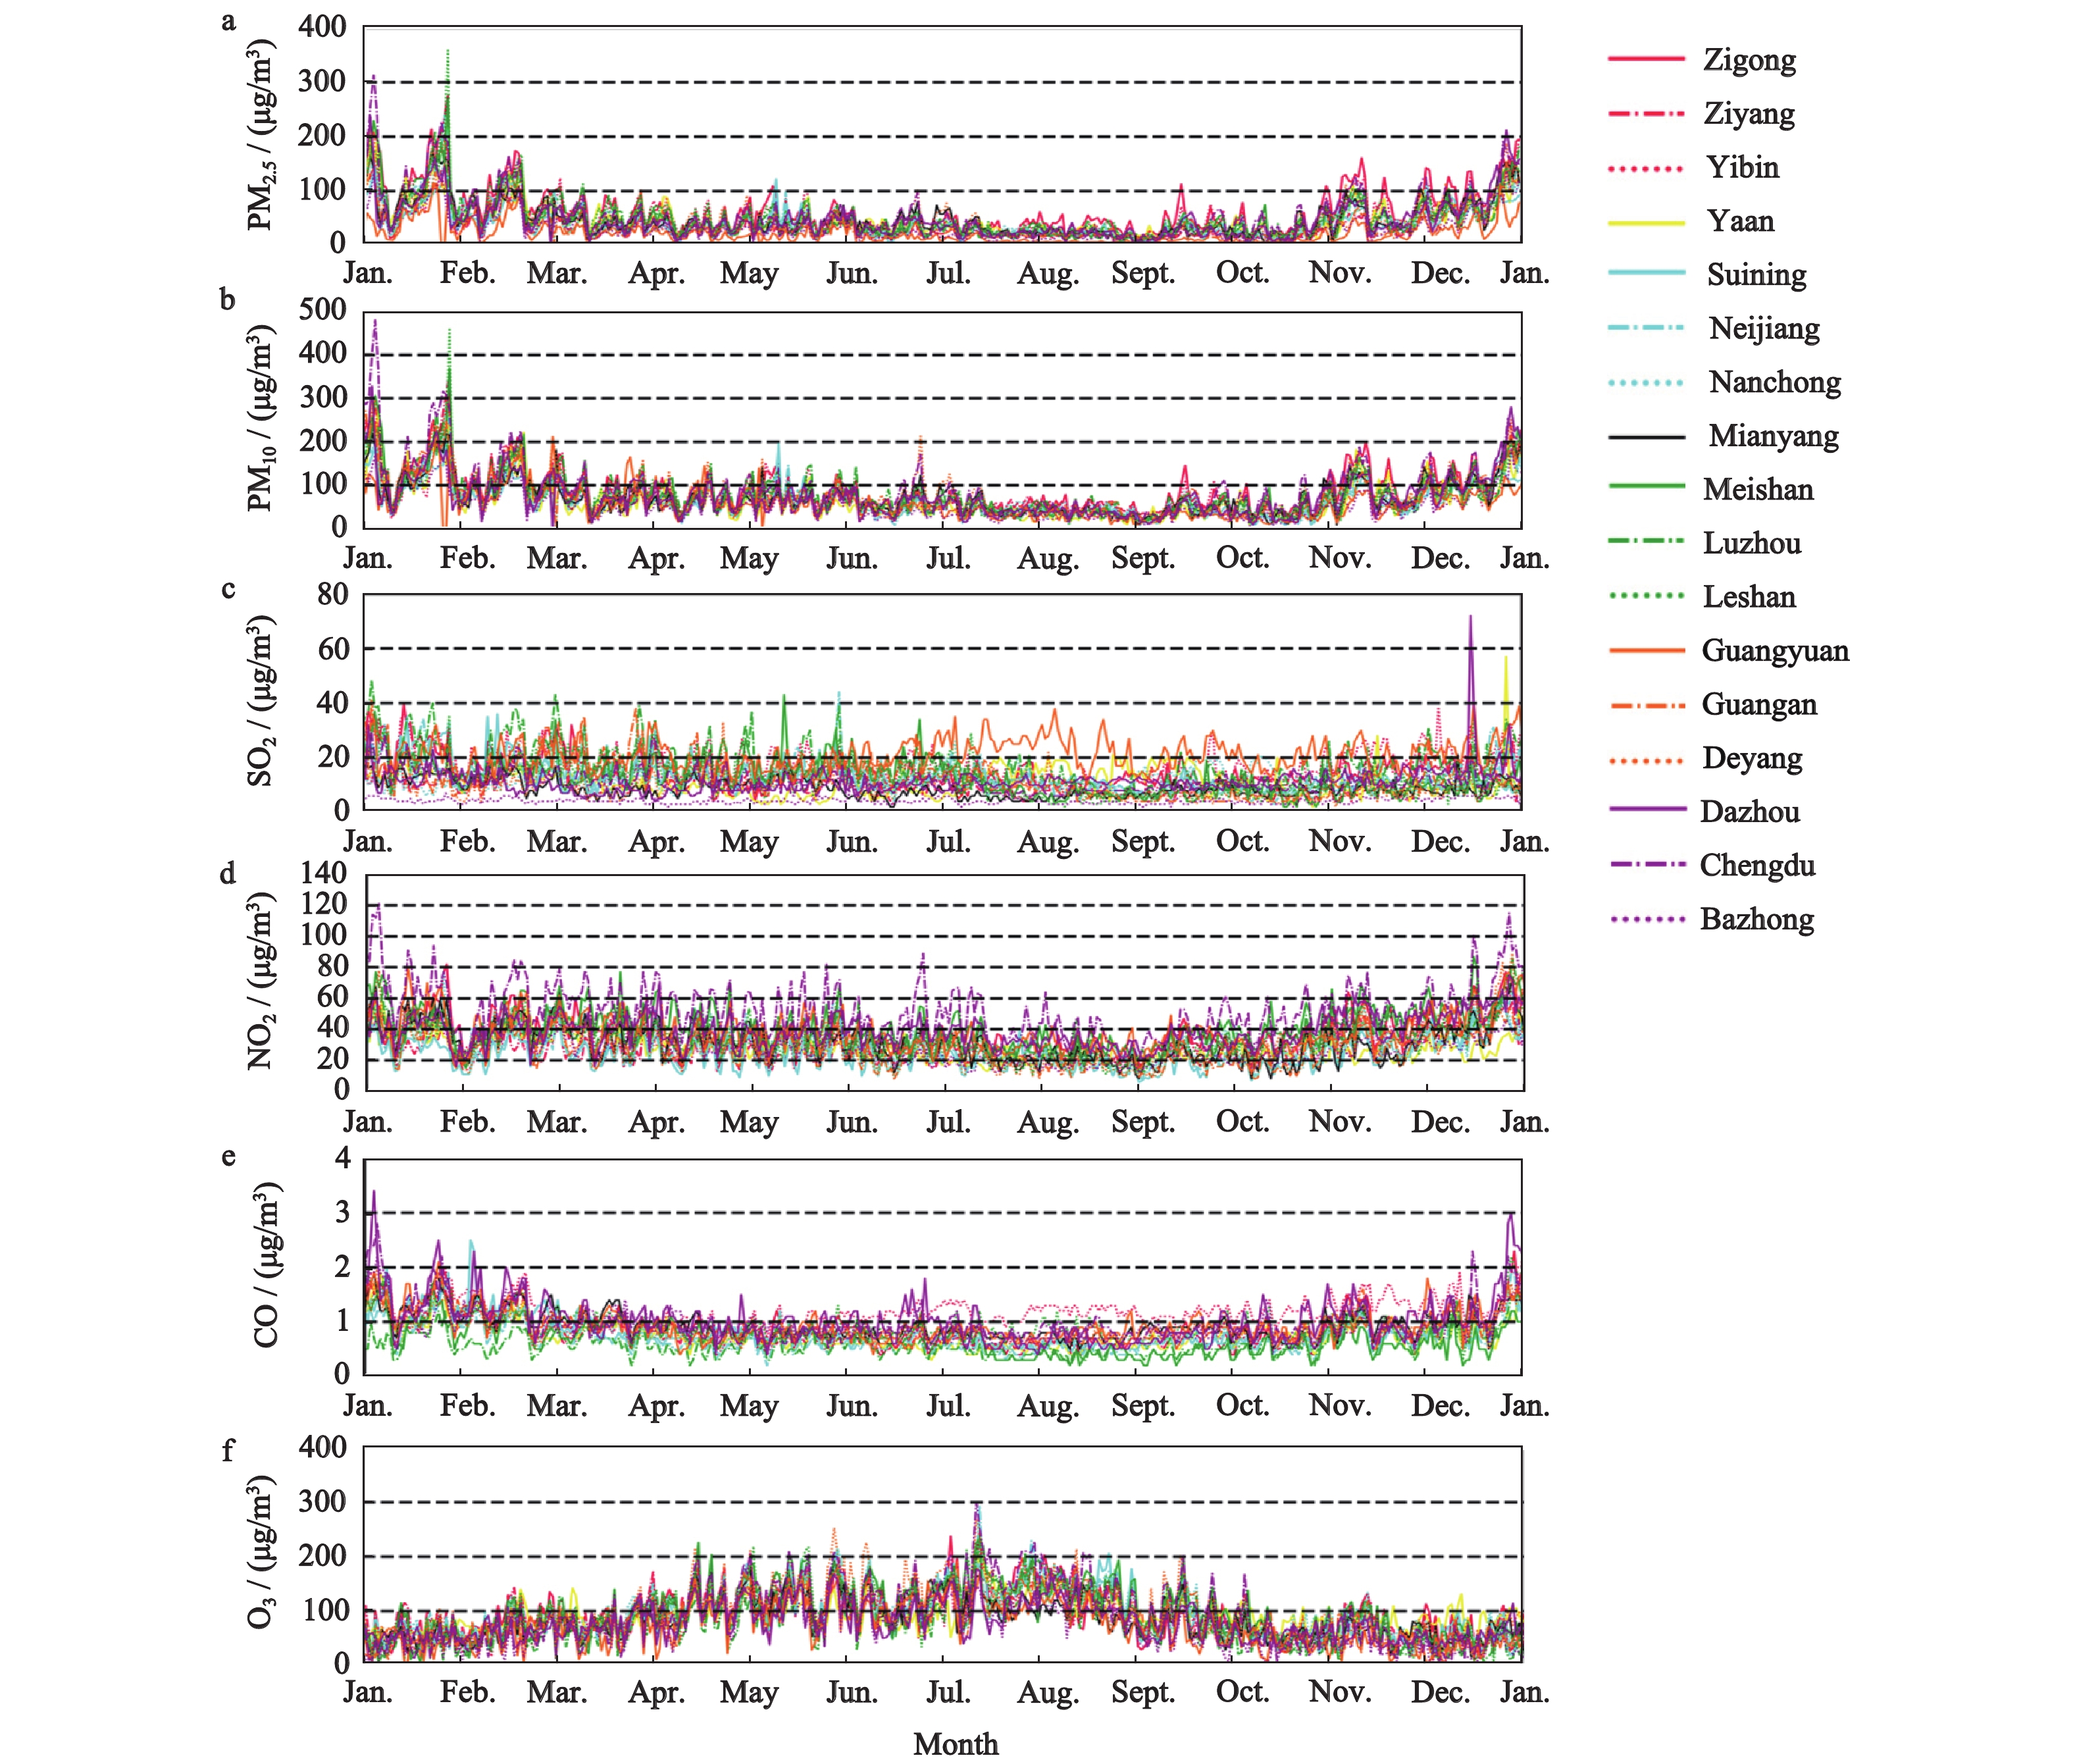
This study used 2017 as the research period to analyze the atmospheric pollution and causes of haze during each season. Fig. 4 and Table 3 depict the changing characteristics of different pollution gases and meteorological factors in 2017. In winter (January, February, and December), PM2.5 and PM10 values were higher (Figs. 5a,5b), especially in January. However, most of the daily AQI values were between 200 and 300 during these months (Fig. 3c). PM2.5 and PM10 reached their highest values of the year during these months, 350 and 400 μg/m3, respectively. Here, SO2, NO2, and CO were also at their highest values owing to the increased volume of emissions.
Table 3. Annual and monthly average air quality index (AQI) values, pollutant concentrations, wind speed (WS), relative humidity (RH), maximum temperature (Tmax), minimum temperature (Tmin), and monthly average air quality index (AQI) decision coefficient (R2) in the Sichuan Basin (SCB), China, in 2017
Variable Jan. Feb. Mar. Apr. May Jun. Jul. Aug. Sep. Oct. Nov. Dec. Average AQI 133.88 95.54 71.36 69.78 82.48 68.11 83.80 68.10 52.36 46.59 77.10 119.47 80.71 PM2.5 / (μg/m3) 100.62 69.18 45.51 35.65 41.47 31.57 26.00 21.77 26.02 26.46 53.72 79.26 46.44 PM10 / (μg/m3) 145.43 103.20 76.52 65.43 73.29 54.29 45.74 37.14 44.03 42.66 84.24 115.49 73.95 SO2 / (μg/m3) 17.33 14.54 14.01 13.13 13.03 12.13 11.68 9.09 10.08 9.38 11.79 13.91 12.51 NO2 / (μg/m3) 41.88 37.17 38.18 33.01 32.79 28.75 25.80 22.04 26.93 28.72 37.92 47.98 33.43 CO / (μg/m3) 1.27 1.10 0.91 0.77 0.76 0.75 0.67 0.67 0.74 0.76 0.92 1.15 0.87 O3 / (μg/m3) 51.81 66.61 77.21 108.22 124.51 111.2 138.09 118.28 81.59 54.15 59.62 33.01 85.36 PM10/PM2.5 1.45 1.49 1.68 1.84 1.77 1.72 1.76 1.71 1.69 1.61 1.57 1.46 1.59 Tmax / ℃ 12 13 16 24 28 28 33 32 26 20 17 12 21.75 Tmin / ℃ 6 7 10 15 18 21 24 24 20 15 11 5 14.67 RH /% 77.51 76.2 76.83 70.07 67.47 77.82 71.85 74.55 83.08 88.54 81.01 78.91 77 WS / (m/s) 1.54 1.64 1.85 2.20 2.20 1.94 2.12 2.14 1.72 1.66 1.51 1.45 1.83 R2 (n = 17, P < 0.01) 0.90 0.85 0.71 0.59 0.64 0.44 0.76 0.44 0.74 0.77 0.83 0.67 − Notes: n, number of cities; P, detection correlation degree 
Figure 5. Daily variations in the pollutant concentrations in 17 cities of the Sichuan Basin (SCB), China, in 2017
In spring, PM2.5, and PM10 maintained high values, with AQI values > 100 (Figs. 3c and 5b) in many periods, especially in May. During spring, SO2, NO2, and CO gradually decreased and the PM10/PM2.5 ratio (> 1.67) indicated that the particle pollution was coarse (Huang et al., 2018).
In summer, many periods saw AQI > 100, with some periods even > 200, mainly in July (Fig. 3c). Here, SO2, NO2, and CO dropped to their lowest values for the entire year, and the PM10/PM2.5 ratio (> 1.67) indicated coarse particle pollution (Huang et al., 2018).
Autumn was the season with the best air quality in 2017; however, in November, the AQI value was high, often over 200. Compared with October, the AQI, PM2.5, PM10, SO2, NO2, and CO for November increased by 65.49%, 103%, 74.47%, 25.69%, 32.03%, and 21.05%, respectively.
The O3 values were highest from April to August, reaching the highest value of ~300 in July. Most O3 on the ground formed by the transformation of nitrogen oxides and volatile organic compounds emitted by humans under high temperature, sufficient sunshine, and air drying conditions (Duan et al., 2012, Guo et al., 2017a); the relationship between the O3 concentration and regional wind speed was weak (Xie et al., 2019).
-
There is a close relationship between haze events and several meteorological parameters, and the causal relationship between them due to the confounding effect induced by meteorology is still elusive. RH was calculated from air temperature and the temperature of the dew point (Td); the calculation of Td mainly depended on the absolute temperature and saturated vapor pressure of the pure horizontal liquid surface (Goff, 1957). Therefore, the RH can reflect multiple meteorological parameters. The higher RH with increases in the hygroscopicity can also aggravate the severity of air pollution (Rastak et al., 2014; Li et al., 2017). Some studies have shown that near-surface WS can significantly affect air pollution concentrations (Liu et al., 2013; Zhang et al., 2014), and low wind and air stagnant condition can weaken the spread and diffusion of pollutants, leading to air quality deterioration (Allwine and Whiteman, 1994; Venegas and Mazzeo, 1999; Goyal and Rama Krishna, 2002; Wang et al., 2018b). An average near-surface WS higher than 3.5 m/s can significantly reduce the concentration of fine particles (PM2.5) (Lin et al., 2015). The surface WS played a major role in the change in haze conditions (Li et al., 2016). Therefore, this study used WS and RH as the main meteorological factors for analysis.
In the SCB, the mean WS was lower (1.83 m/s) in 2017 (Table 3), with the WS being highest in spring, followed by summer, winter, and autumn (Fig. 6a). The fire point data were the highest in summer, followed by spring, winter, and autumn (Fig. 6b). The annual mean RH was 77% (Table 3), with the highest humidity occurring in autumn, followed by winter, summer, and spring (Fig. 6c). These characteristics provided favorable support for the cause of pollution.

Figure 6. Spatio-temporal variation in the (a) wind speed (WS), (b) fire point, and (c) and relative humidity (RH) of the Sichuan Basin (SCB), China in 2017. MAM, spring: March–May; JJA, summer: June–August; SON, autumn: September–November; and DJF, winter: January, February, and December
Therefore, we can speculate that in autumn and winter, when the RH is higher and the temperature and WS are lower, the higher concentrations of SO2, NO2, and CO show that most pollution sources were local pollution gas emissions while the PM10/PM2.5 ratio (< 1.67) indicated fine-grained pollution (Huang et al., 2018). In contrast, the spring and summer were mainly dominated by coarse-grained pollution. Due to the higher WS, pollution may originate from long-distance dust transmission, and dense fire points also have a greater contribution.
-
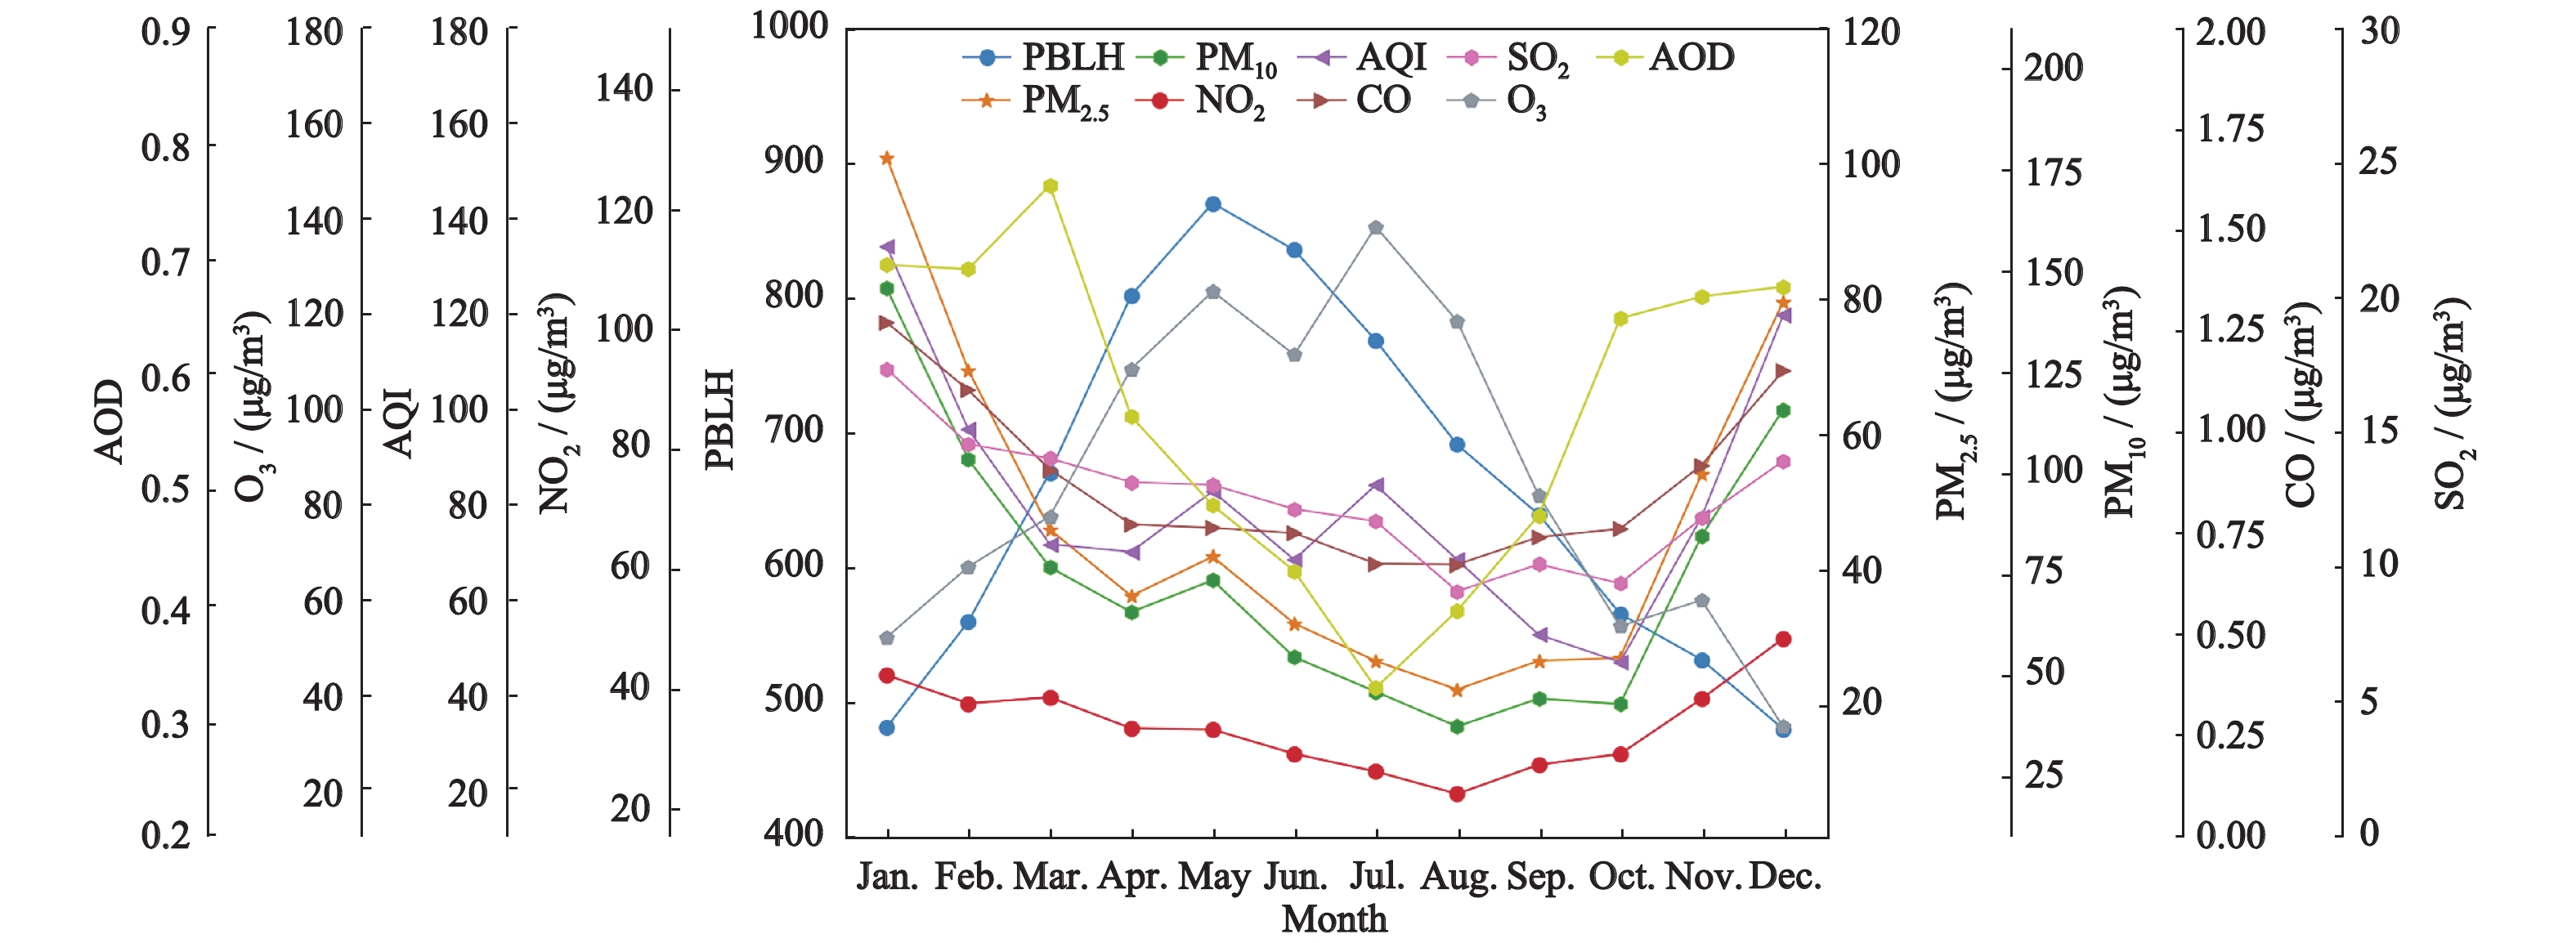
PBLH is one of the important physical parameters of the atmospheric numerical model and atmospheric environmental assessments. PBLH reflected the movement of air flow and was negatively associated with the AOD (Li et al., 2018). AOD was also the main indicator of air pollution. Fig. 7 shows the relationship between air pollution concentration and the PBLH and AOD in the SCB in 2017. The PBLH was overall negatively correlated with the AQI, PM2.5, PM10, SO2, NO2, CO, and AOD. In autumn and winter, the negative correlation was notable; the lower PBLH value during winter may reflect reduced air movement and serious pollution in this period, indicating that lower wind speeds and higher RHs played a major role. In spring and summer, although the higher PBLH value usually reflects frequent air movement and good air quality, the higher temperature, higher wind speed, and denser fire points (Fig. 6) may have resulted in the increasing trend in the air pollution concentration in May and July. In autumn and winter, the high AOD value reflects serious pollution. Owing to the complex relationship between the AOD, pollutants, and meteorological factors, aerosols have a cumulative effect (Ye et al., 2011). AOD accumulation in January and February likely led to the highest value in March. After April, with the increase in wind speed, the AOD value gradually decreased. Therefore, the AOD poorly reflects air pollution in spring and summer. To better analyze the cause of pollution, we must combine the aerosol subtypes and backward trajectories for further analysis.

Figure 7. The variation characteristics of the pollutant concentrations and air quality index (AQI), and the planetary boundary layer height (PBLH) and Aerosol Optical Depth (AOD) in the Sichuan Basin (SCB), China in 2017
-
According to the above inference and analysis, 2017 was divided into three periods for the analysis of haze events. The first period was May in spring, the second period was July in summer, and the third period was November in late autumn and January in winter. In this section, aerosol subtypes and backward trajectories are used to analyze the causes of haze pollution.
-
Dust weather often occurs in April and May in Northwest China (NC). In the spring of 2017, the WS was the highest (Fig. 6a). The average number of pollution days during May 2017 was high (Table 2), with the PM10/PM2.5 ratio was 1.77 (Table 3). Air particles were predominately coarse particles, mostly caused by dust.
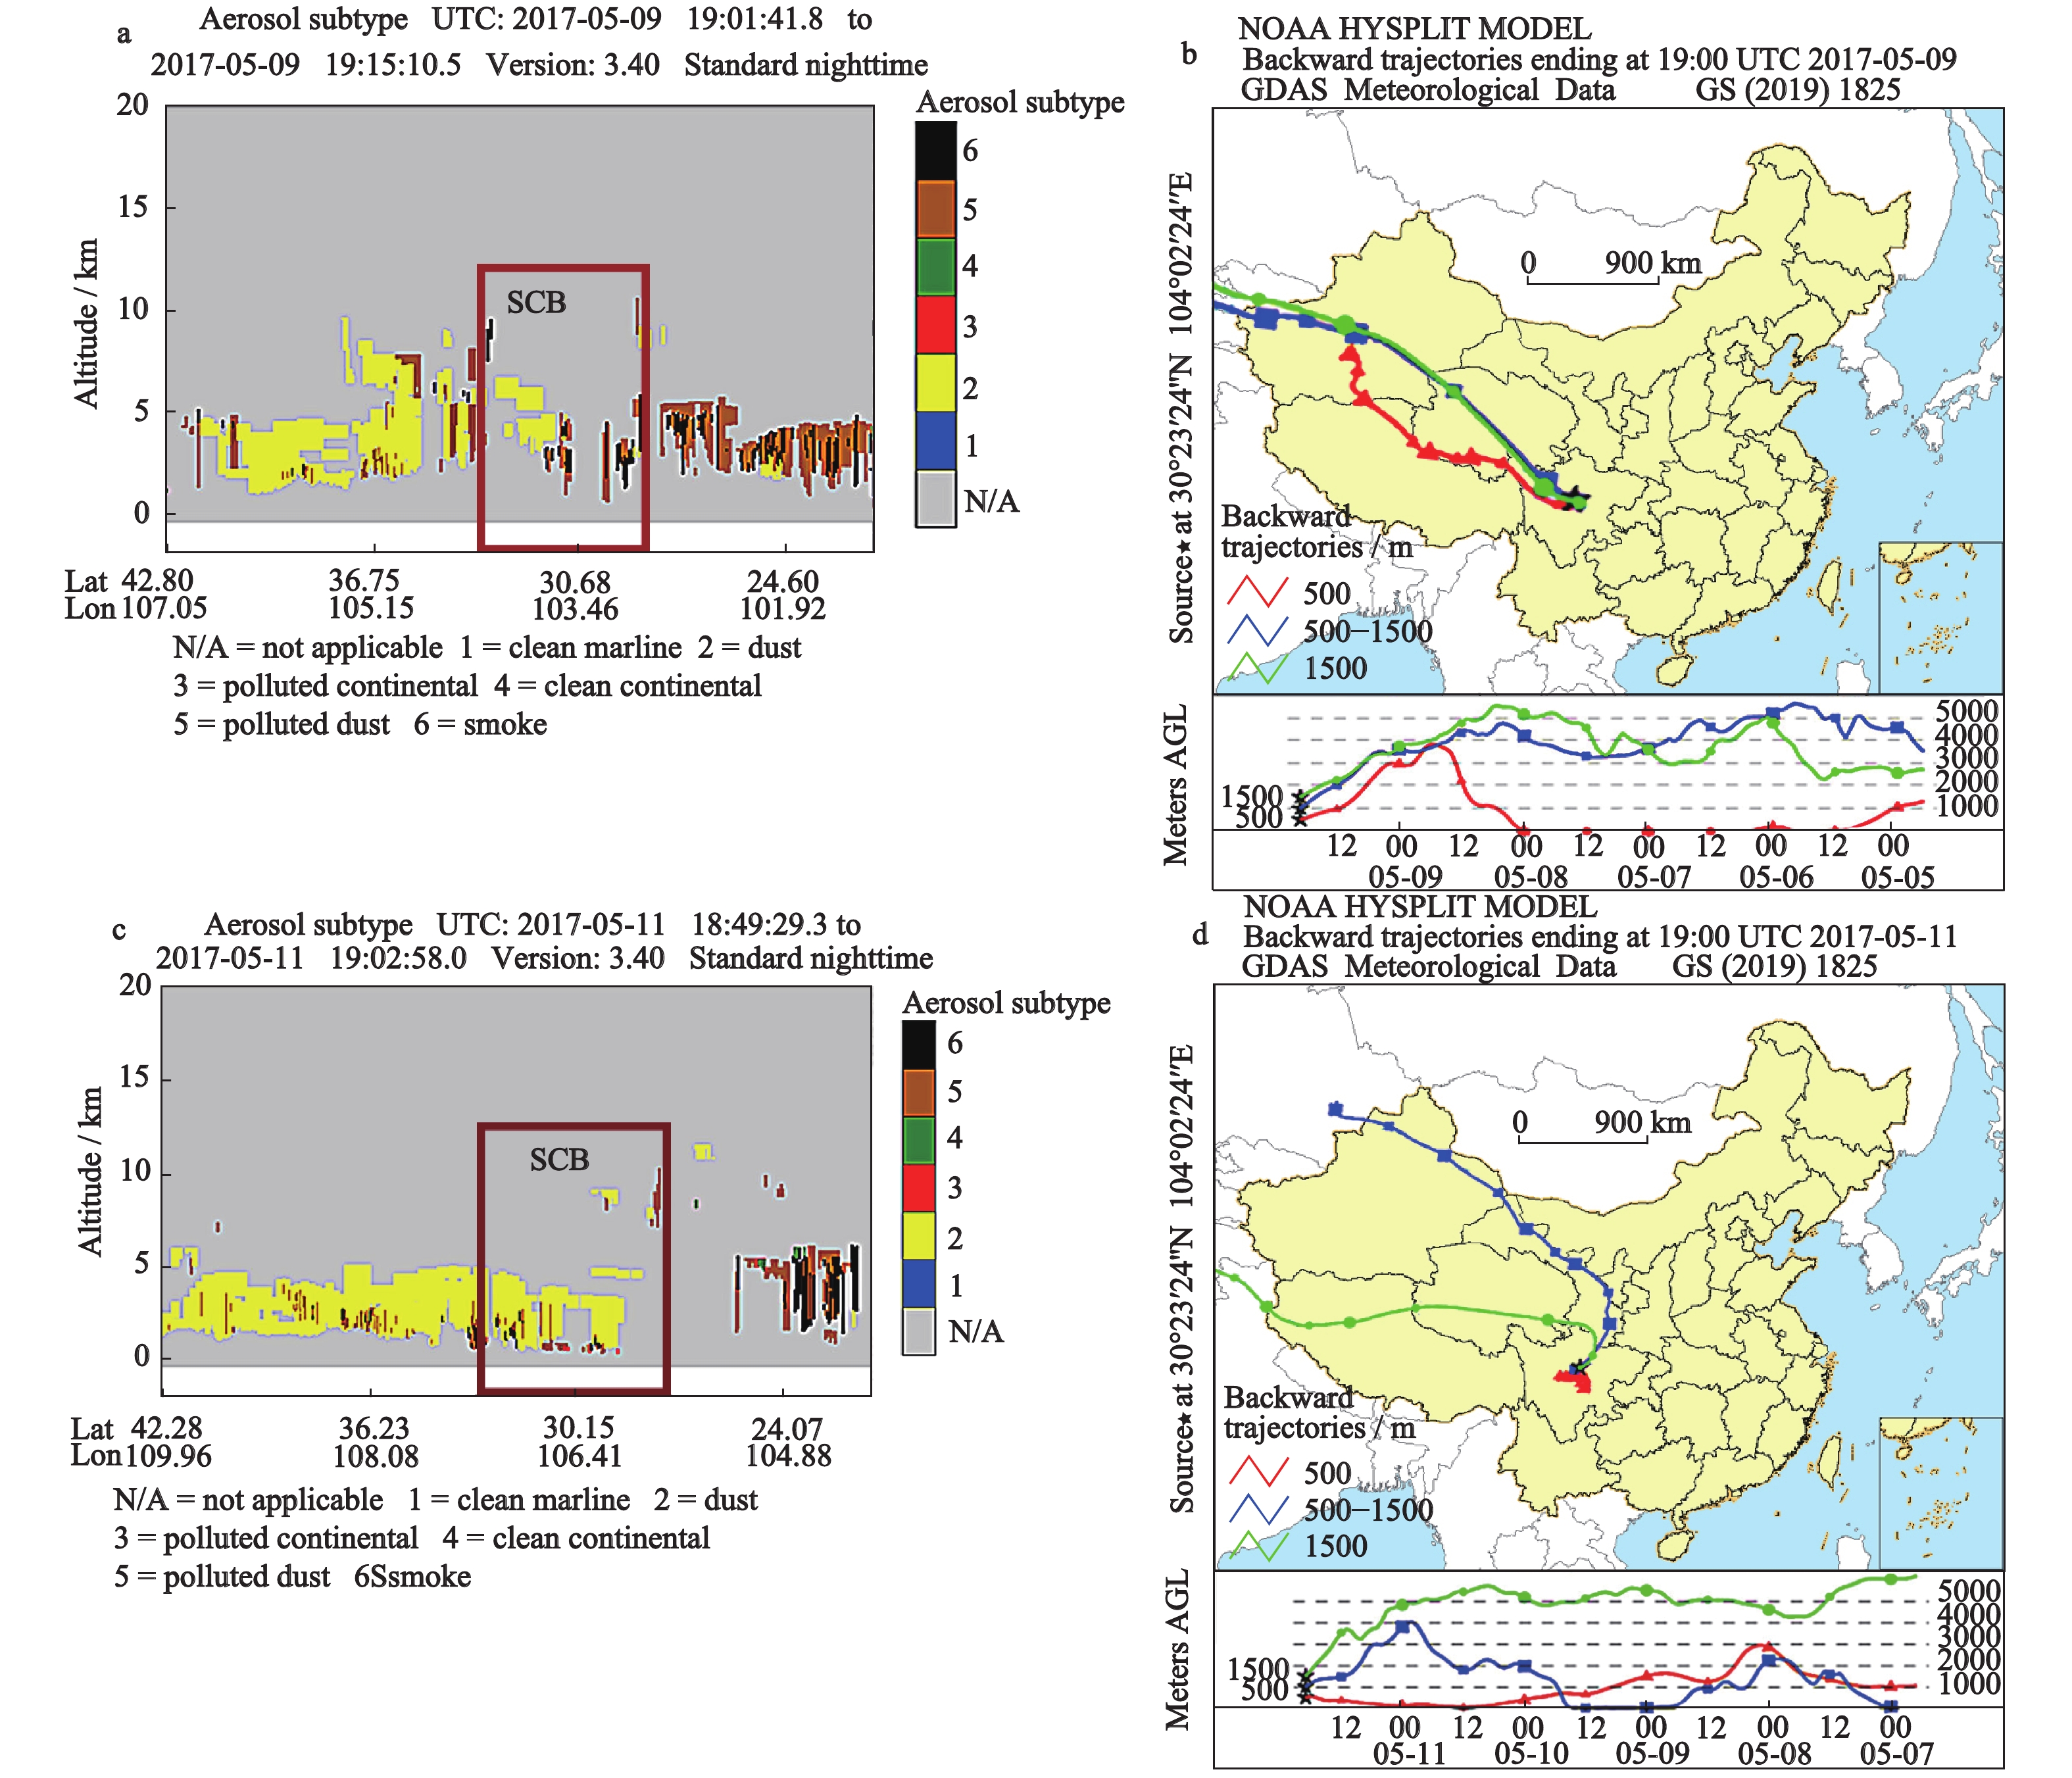
The CALIPSO satellite image revealed aerosol subtypes at 19:15:10.5 on May 9, 2017, which were mixed with polluted dust and a large amount of smoke (Fig. 8a). According to Fig. 6b, there were more fire points in spring, and the smoke may have been caused by local burning of biomass and waste incineration. The 5-d backward trajectories of air masses (Fig. 8b) showed that the tracks of all three air masses came from NC, which confirmed that the dust was windblown from NC. The polluted dust reflected the local emissions of atmospheric pollutants.

Figure 8. The heavy haze period in the Sichuan Basin (SCB), China in spring, 2017, for the aerosol subtype retrieved by CALIPSO. a. aerosol subtype on 2017-05-09 19:01:41.8–19:15:10.5 Coordinated Universal Time (UTC); b. the 5-d backward trajectories of Chengdu in 2017-05-05-2017-05-09 UTC, c. aerosol subtype on 2017-05-11 18:49:29.3–19:02:58.0 UTC, d. the 5-d backward trajectories of Chengdu in 2017-05-07-2017-05-11 UTC. CALIPSO: Cloud-Aerosol Lidar and Infrared Pathfinder Satellite Observations
The CALIPSO satellite image revealed aerosol subtypes at 19:02:58.0 on May 11, 2017, which were mixed with polluted dust, smoke, and a large amount of dust (Fig. 8c), i.e., was almost all dust. The 5-d backward trajectories of the air masses (Fig. 8d) showed that one air mass originated from NC and another air mass moved locally, which confirmed both regions as sources of dust. High wind speeds can increase local dust emissions from farmlands, river beaches, roads, and construction sites. Previous studies have suggested that the total amount of dust emitted from agricultural activities was higher than the amount of natural windblown dust in spring (Chen et al., 2018). Thus, the dust was composed of NC windblown dust and local dust in this period.
-
In the summer of 2017, air pollution was the most severe in July (Table 2), and the highest AQI value exceeded 200 (Fig. 3c). The average temperature was highest, the average WS was high, the RH was low, the O3 value was the highest, the concentrations of SO2, NO2, and CO were low (Table 3), and the number of fire points was the highest in summer (Fig. 6b). Higher temperatures and higher O3 concentrations can be easily attributed as the cause of secondary reactions of SO2 and NO2 (Sheng et al., 2018). These were the possible causes of summer pollution and haze events.
The CALIPSO satellite image located in the northeastern region of the SCB revealed aerosol subtypes at 18:57:26.7 on July 7, 2017, mixed with dust, smoke, and polluted dust (Fig. 9a). The proportion of smoke was large, and the proportion of polluted dust and dust was small. The 5-d backward trajectories of the air masses (Fig. 9b) showed that the tracks of the three air masses all derived from NC, indicating that NC may be the source of dust. The smoke was related to the dense fire points, and a small amount of polluted dust may have originated from local pollution discharge.

Figure 9. The heavy haze period in the Sichuan Basin (SCB), China in summer, 2017, for the aerosol subtype retrieved by CALIPSO. a. aerosol subtype on 2017-07-07 18:43:58.0-18:57:26.7 Coordinated Universal Time (UTC), b. backward trajectories of Chengdu in 2017-07-03-2017-07-07 UTC, c. aerosol subtype on 2017-07-12 19:02:13.5–19:15:42.2 UTC, d. backward trajectories of Chengdu in 2017-07-08-2017-07-12 UTC. CALIPSO: Cloud-Aerosol Lidar and Infrared Pathfinder Satellite Observations
The CALIPSO satellite image of the SCB revealed aerosol subtypes at 19:15:42.2 on July 12 mixed with a large amount of smoke and polluted dust, with a few dust particles (Fig. 9c). The 5-d backward trajectories of air masses (Fig. 9d) showed that some air masses track originated from NC. Dust may derive from the NC or local sources. In summer, there were 831 fire points (Fig. 6b), which caused abundant smoke. These fire points mainly came from local biomass burning and incineration. During this period, the SO2 concentration did not increase as much as the combustion season in Northeast China. There are several possible reasons for this: 1) there were more than 8000 fire points in Northeast China in the biological combustion season (Chen et al., 2018); however, this was more than 10-fold than that in the SCB; 2) in summer in the SCB, the higher temperature, higher RH, and increased light easily lead to the dilution and oxidation of NO2 and SO2 to form NO3– and SO42– (Sheng et al., 2018); and 3) the air flow diffusion speed was fast due to the higher WS in summer.
-
In November 2017, there was a significant deterioration in air quality (Table 2). The temperature decreased while the WS, RH, and concentrations of NO2 and CO increased. The concentration of SO2 increased significantly, and air pollution was at significantly higher levels, which manifested as fine particles (PM10/PM2.5 < 1.67) (Huang et al., 2018) (Table 3). In winter, the air quality was at its worst level compared with the rest of the year, especially in January. The WS was lower, the RH increased, the temperature reached its lowest level in the entire year, and the concentrations of SO2, NO2, and CO were at their highest levels in the year, which manifested as fine particles (PM10/PM2.5 < 1.67) (Huang et al., 2018) (Table 3). The variations in haze days in winter were closely related to the variability of the WS. The weaker (stronger) the WS, the more (less) haze days that occurred (Shi et al., 2019).
The meteorological and emissions data in late autumn and winter were similar, and the contributing factors leading to haze were also similar. The major causes of severe haze in late autumn and winter were meteorological, with low WSs and high RHs that caused extremely poor ventilation conditions and a stagnant climate. The low temperature, insufficient sunlight, and the not easily spread high emissions pollutant gases most likely caused haze events and severe air pollution.
The CALIPSO satellite image of the SCB revealed aerosol subtypes at 19:06:21.6 on November 3, 2017, mixed with a large amount of smoke, polluted dust, and dust, with a few polluted continental (Fig. 10a). A large amount of polluted dust and a few polluted continental areas originated from motor vehicle emissions, industrial pollution, and human factors, among others, which were consistent with the high concentrations of SO2, NO2, and CO. In this season, few fire points (Fig. 6b) showed that a large amount of smoke may derive from the combustion of coal and gas in industrial sectors, which is consistent with the rise in SO2. Previous studies have shown a comparable trend of low RH and high WSs, yielding local dust events (Csavina et al., 2014). Therefore, the climatic conditions in November were less likely to produce local dust. The 5-d backward trajectories of air masses (Fig. 10b) showed that there was an air mass track from the NC, such that the dust may have originated from the NC.

Figure 10. The heavy haze periods in the Sichuan Basin (SCB), China in late autumn and winter, 2017, for the aerosol subtypes retrieved by CALIPSO. a. aerosol subtypes on 2017-11- 03 18:52:52.8-19:06:21.6 Coordinated Universal Time (UTC) b. backward trajectories of Chengdu in 2017-10-30-2017-11-03 UTC, c. aerosol subtypes on 2017-01-26 18:58:16.5-19:11:45.2 UTC, d. backward trajectories of Chengdu in 2017-01-22-2017-01-25 UTC. CALIPSO: Cloud-Aerosol Lidar and Infrared Pathfinder Satellite Observations
The CALIPSO satellite image passing through the SCB revealed aerosol subtypes at 19:11:45.2 on January 26, 2017, mixed with a large amount of polluted dust, as well as a few smoke and dust (Fig. 10c). The high concentration of NO2 and CO in winter indicated that a large amount of polluted dust originated from motor vehicle emissions, industrial pollution, and human activities in the SCB. In winter, less fire points (Fig. 6b) and high SO2 concentration values indicated that the smoke mainly came from industrial coal combustion and gas combustion, along with other emissions from the ongoing rapid economic and industrial development. The 5-d backward trajectory of air masses (Fig. 10d) showed that there were an air mass that flowed in from NC and two air masses track from the southwest of SCB; therefore, the dust may also derive from NC and some pollution may derive from southwest of SCB.
During the late autumn and winter severe haze period, the concentrations of NO2, SO2, and O3 were lower in the SCB than in northern China. Previous studies found that the temperature and humidity in the SCB were higher than that in northern China in late autumn and winter; therefore, NO2 and SO2 may be prone to chemical reactions that form NO3– and SO42–, causing secondary pollution (Shao et al., 2018; Liu et al., 2019a; Liao et al., 2020).
-
The aerosol subtypes of the four groups of non-pollution weather in the three pollution periods were obtained. Compared with the polluted weather, they reflected that the sky was clean, with only a small amount of smoke, dust, and polluted dust (Fig. 11).

Figure 11. The non-pollution period in the Sichuan Basin (SCB), China in 2017, for the aerosol subtypes retrieved by CALIPSO (a. 2017-01-07 06:28:13.3−06:40:06.8; b. 2017-03-05 06:13:53.6−06:27:22.2; c. 2017-06-03 18:56:50.7−19:10:19.4; d. 2017-11-16 06:09:41.9−06:23:10.6 Coordinated Universal Time (UTC)). CALIPSO: Cloud-Aerosol Lidar and Infrared Pathfinder Satellite Observations
-
Most of the studies are in a certain period and a certain location in SCB, China, and lack of research on the large spatial-temporal scale data. Therefore, the spatial-temporal variations of air pollution and the characteristics of seasonal pollution in SCB have not been reported thoroughly. This study tried to fill the mentioned gaps by considering multiple tools, methods, and datasets. Based on our results and analysis, we obtained an in-depth understanding of the seasonal variation and formation mechanism of air pollution and heavy haze in SCB.
In SCB, China, the annual AQI variation rule reflected the seasonality, in which AQIwinter > AQIspring > AQIsummer > AQIautumn. From 2015 to 2018, the overall air quality noticeably improved. From 2015 to 2016, the AQI value increased. However, the AQI value has decreased since 2017, and the air quality has improved, particularly between 2017 and 2018. Based on the detailed analysis of the 2017 data, the air pollution in winter was the most serious and persistent, which was the peak period of haze. The air pollution days in spring were frequent and prone to haze events. The air quality in summer was slightly better than that in spring but was also prone to haze events. Overall, the air quality in autumn was the best, mainly in September and October, but the numbers of air pollution days in November were frequent and prone to haze events.
In spring, the PM10/PM2.5 value revealed the dominance of coarse-mode particles. The main characteristic of air pollution is dust. The higher PBLH and WS indicate that the air flow is active, which creates conditions for local dust, and also indicates the existence of external airflow. More fire points also contribute to air pollution. During the spring haze period, the aerosol subtypes were composed of dust, smoke, and polluted dust, in which the proportion of dust was large and pollution dust was small. The main causes of haze were windblown dust from NC, and local dust, local biomass burning, and waste incineration, and some local pollution gas emissions;
In summer, the main characteristic of air pollution is smoke. A large number of fire points contribute to air pollution. During the summer haze period, the aerosol subtypes were composed of dust, smoke, and pollution dust. The proportion of smoke was large, and the proportion of pollution dust and dust was small. The main reason for haze in summer was a large amount of smoke caused by local burning and pollution dust from the emissions of local pollutants, as well as a small amount of dust from NC.
In late autumn and winter, the PM10/PM2.5 value revealed the dominance of fine-mode particles. The main characteristic of air pollution is pollution emissions in local. This unfavourable diffusion conditions such as the shallowest PBLH (Fig. 7), the lowest WS and the higher RH (Fig. 6) prone to frequency of air stagnation and led to the easy aggregation of atmospheric pollutant emissions, which in turn led to serious pollution and haze events in SCB, China. This result is consistent with previous studies (Wang et al., 2014; Liao et al., 2018). During late autumn haze period, aerosol subtypes mixed with a large amount of smoke, polluted dust, and dust, with a few polluted continental. During winter haze period, aerosol subtypes mixed with a large amount of polluted dust, as well as a few smoke and dust. The two haze period major sources of atmospheric pollutants attributed to anthropogenic activities (vehicle emissions, industrial pollution, and coal and gas emissions) in SCB, the possibility of airflow from southwest of SCB, secondary pollutants and dust from NC.
This study provides reliable data for the prevention and treatment of pollution in different periods in the SCB and can also play an important role in the mitigation of pollution and the construction of an ecologically minded civilization.
-
In SCB, China, the AQI has been greatly improved from 2015 to 2018. The air pollution and haze events in winter was the most serious and persistent. The air pollution in spring was more and prone to haze events, and more in May. The air pollution and haze events in summer were more occurred in July. The air pollution and haze events in autumn mainly occur in November. During the spring haze period, the aerosol subtype was almost dust, and the main source was dust from NC and local. During the summer haze period, the main aerosol subtype was smoke, and the main source was the local dense burning. During late autumn haze period, the aerosol subtypes mainly composed of smoke, polluted dust, and dust. During winter haze period, the aerosol subtypes mainly composed of polluted dust and smoke. In late autumn and winter, the major sources of atmospheric pollutants mainly come from emissions caused by human activities in local, secondary pollutants and dust from NC. The results derived in this study contribute to an in-depth understanding of the seasonal variation and formation mechanism of air pollution and heavy haze in SCB, China, be essential for evaluating air quality and its effects on the climate, environment, and human health in local, and forms a basis for the extension of future research over the region with terrain such as basins and mountains.
Spatio-temporal Characteristics of Atmospheric Pollution and Cause Analysis of Haze Events in Sichuan Basin, China
-
Abstract: This study analyzed the spatio-temporal variability of air quality data for six standard air pollutants (Particulate Matter 2.5 (PM2.5), Particulate Matter 10 (PM10), SO2, NO2, CO, and O3) in the Sichuan Basin (SCB), China from 2015 to 2018 in relation to the formation of haze using conventional meteorological data (temperature, wind speed, and relative humidity), satellite data (fire point data, vertical profiles of aerosol subtypes, and aerosol optical depth), planetary boundary layer height, and backward trajectories. The results indicated that the spatio-temporal evolution of the air quality index (AQI) had notable seasonality for the pollution severity in descending order: winter, spring, summer, and autumn. Autumn and winter severe haze events occurred in November and January, respectively, and were caused by higher local pollution emissions under stagnant air conditions. Spring severe haze events occurred in May and were caused by dust from Northwest China and local regions. Severe summer haze events occurred in July and were caused by local burning. Therefore, the analyses showed that local burning, stagnant meteorological conditions, air mass transport and anthropogenic pollution emissions played a key role in haze in the SCB. This study provides scientific insights for fully analyzing heavy air pollution in SCB, China, and also provides a scientific basis for pollution research in regions of complex terrain as basins and mountains.
-
Key words:
- Atmospheric pollution /
- formation of haze /
- aerosol subtypes /
- backward trajectories /
- Sichuan Basin
-
Figure 1. Regional topography and atmospheric monitoring sites in the Sichuan Basin (SCB), China
Figure 2. The spatio-temporal variation in the air quality index (AQI) by season in the Sichuan Basin (SCB), China in 2015–2018. MAM, spring: March–May; JJA, summer: June–August; SON, autumn: September–November; and DJF, winter: January, February, and December
Figure 3. Air quality index (AQI) daily variation in 17 cities across the Sichuan Basin (SCB), China
Figure 5. Daily variations in the pollutant concentrations in 17 cities of the Sichuan Basin (SCB), China, in 2017
Figure 6. Spatio-temporal variation in the (a) wind speed (WS), (b) fire point, and (c) and relative humidity (RH) of the Sichuan Basin (SCB), China in 2017. MAM, spring: March–May; JJA, summer: June–August; SON, autumn: September–November; and DJF, winter: January, February, and December
Figure 7. The variation characteristics of the pollutant concentrations and air quality index (AQI), and the planetary boundary layer height (PBLH) and Aerosol Optical Depth (AOD) in the Sichuan Basin (SCB), China in 2017
Figure 8. The heavy haze period in the Sichuan Basin (SCB), China in spring, 2017, for the aerosol subtype retrieved by CALIPSO. a. aerosol subtype on 2017-05-09 19:01:41.8–19:15:10.5 Coordinated Universal Time (UTC); b. the 5-d backward trajectories of Chengdu in 2017-05-05-2017-05-09 UTC, c. aerosol subtype on 2017-05-11 18:49:29.3–19:02:58.0 UTC, d. the 5-d backward trajectories of Chengdu in 2017-05-07-2017-05-11 UTC. CALIPSO: Cloud-Aerosol Lidar and Infrared Pathfinder Satellite Observations
Figure 9. The heavy haze period in the Sichuan Basin (SCB), China in summer, 2017, for the aerosol subtype retrieved by CALIPSO. a. aerosol subtype on 2017-07-07 18:43:58.0-18:57:26.7 Coordinated Universal Time (UTC), b. backward trajectories of Chengdu in 2017-07-03-2017-07-07 UTC, c. aerosol subtype on 2017-07-12 19:02:13.5–19:15:42.2 UTC, d. backward trajectories of Chengdu in 2017-07-08-2017-07-12 UTC. CALIPSO: Cloud-Aerosol Lidar and Infrared Pathfinder Satellite Observations
Figure 10. The heavy haze periods in the Sichuan Basin (SCB), China in late autumn and winter, 2017, for the aerosol subtypes retrieved by CALIPSO. a. aerosol subtypes on 2017-11- 03 18:52:52.8-19:06:21.6 Coordinated Universal Time (UTC) b. backward trajectories of Chengdu in 2017-10-30-2017-11-03 UTC, c. aerosol subtypes on 2017-01-26 18:58:16.5-19:11:45.2 UTC, d. backward trajectories of Chengdu in 2017-01-22-2017-01-25 UTC. CALIPSO: Cloud-Aerosol Lidar and Infrared Pathfinder Satellite Observations
Figure 11. The non-pollution period in the Sichuan Basin (SCB), China in 2017, for the aerosol subtypes retrieved by CALIPSO (a. 2017-01-07 06:28:13.3−06:40:06.8; b. 2017-03-05 06:13:53.6−06:27:22.2; c. 2017-06-03 18:56:50.7−19:10:19.4; d. 2017-11-16 06:09:41.9−06:23:10.6 Coordinated Universal Time (UTC)). CALIPSO: Cloud-Aerosol Lidar and Infrared Pathfinder Satellite Observations
Table 1. Annual average air quality index (AQI) value, seasonal average AQI value, and pollution days in the Sichuan Basin (SCB), China, from 2015–2018
Year AQI-Y AQI-MAM AQI-JJA AQI-SON AQI-DJF PDY PDMAM PDJJA PDSON PDDJF 2015 82.18±3.78 79.94±3.52 70.06±3.97 64.90±4.21 113.84±8.75 86±26 20±6 10±6 10±5 46±9 2016 82.73±3.18 77.79±4.23 69.79±4.19 74.02±5.41 109.31±5.24 100±24 20±6 13±5 18±6 49±7 2017 80.71±3.87 74.54±3.04 73.34±4.10 58.68±4.90 116.29±7.31 89±21 16±5 15±6 9±5 49±7 2018 68.98±2.36 70.57±2.72 61.60±2.98 54.97±3.33 88.77±3.86 55±18 12±4 8±4 5±4 30±6 Notes: Annual average air quality index value (AQI-Y); Spring average air quality index (AQI-MAM); Summer average air quality index (AQI-JJA); Autumn average air quality index (AQI-SON); Winter average air quality index (AQI-DJF); Annual average pollution days (PDY); Spring average pollution days (PDMAM); Summer average pollution days (PDJJA); Autumn average pollution days (PDSON); and Winter average pollution days (PDDJF).  下载: 导出CSV
Table 2. Monthly average air quality index (AQI) value and pollution days in the Sichuan Basin (SCB), China from 2015–2018
Year Variable Jan. Feb. Mar. Apr. May Jun. Jul. Aug. Sep. Oct. Nov. Dec. 2015 AQI 141.05 105.75 81.91 77.40 80.50 63.26 78.24 68.68 53.34 76.73 64.63 94.73 Days 21 14 7 7 6 1 6 3 1 7 2 11 2016 AQI 104.58 102.60 87.93 67.90 77.53 73.59 64.62 71.16 67.38 63.26 91.42 120.76 Days 14 14 10 3 7 5 3 5 3 4 11 21 2017 AQI 133.88 95.54 71.36 69.78 82.48 68.11 83.80 68.10 52.36 46.59 77.10 119.47 Days 20 11 4 3 9 2 9 4 1 1 7 18 2018 AQI 92.96 92.40 68.54 71.79 71.37 59.05 56.12 69.62 45.02 53.77 66.13 80.95 Days 12 10 3 5 4 2 2 4 1 1 3 8
下载: 导出CSV
Table 3. Annual and monthly average air quality index (AQI) values, pollutant concentrations, wind speed (WS), relative humidity (RH), maximum temperature (Tmax), minimum temperature (Tmin), and monthly average air quality index (AQI) decision coefficient (R2) in the Sichuan Basin (SCB), China, in 2017
Variable Jan. Feb. Mar. Apr. May Jun. Jul. Aug. Sep. Oct. Nov. Dec. Average AQI 133.88 95.54 71.36 69.78 82.48 68.11 83.80 68.10 52.36 46.59 77.10 119.47 80.71 PM2.5 / (μg/m3) 100.62 69.18 45.51 35.65 41.47 31.57 26.00 21.77 26.02 26.46 53.72 79.26 46.44 PM10 / (μg/m3) 145.43 103.20 76.52 65.43 73.29 54.29 45.74 37.14 44.03 42.66 84.24 115.49 73.95 SO2 / (μg/m3) 17.33 14.54 14.01 13.13 13.03 12.13 11.68 9.09 10.08 9.38 11.79 13.91 12.51 NO2 / (μg/m3) 41.88 37.17 38.18 33.01 32.79 28.75 25.80 22.04 26.93 28.72 37.92 47.98 33.43 CO / (μg/m3) 1.27 1.10 0.91 0.77 0.76 0.75 0.67 0.67 0.74 0.76 0.92 1.15 0.87 O3 / (μg/m3) 51.81 66.61 77.21 108.22 124.51 111.2 138.09 118.28 81.59 54.15 59.62 33.01 85.36 PM10/PM2.5 1.45 1.49 1.68 1.84 1.77 1.72 1.76 1.71 1.69 1.61 1.57 1.46 1.59 Tmax / ℃ 12 13 16 24 28 28 33 32 26 20 17 12 21.75 Tmin / ℃ 6 7 10 15 18 21 24 24 20 15 11 5 14.67 RH /% 77.51 76.2 76.83 70.07 67.47 77.82 71.85 74.55 83.08 88.54 81.01 78.91 77 WS / (m/s) 1.54 1.64 1.85 2.20 2.20 1.94 2.12 2.14 1.72 1.66 1.51 1.45 1.83 R2 (n = 17, P < 0.01) 0.90 0.85 0.71 0.59 0.64 0.44 0.76 0.44 0.74 0.77 0.83 0.67 − Notes: n, number of cities; P, detection correlation degree
下载: 导出CSV
-
[1] Allwine K J, Whiteman C D, 1994. Single-station integral measures of atmospheric stagnation, recirculation and ventilation. Atmospheric Environment, 28(4): 713–721. doi: 10.1016/1352-2310(94)90048-5 [2] Bei N F, Li X P, Tie X X et al., 2020. Impact of synoptic patterns and meteorological elements on the wintertime haze in the Beijing-Tianjin-Hebei region, China from 2013 to 2017. Science of the Total Environment, 704: 135210. doi: 10.1016/j.scitotenv.2019.135210 [3] Bressi M, Sciare J, Ghersi V et al., 2013. A one-year comprehensive chemical characterisation of fine aerosol (PM2.5) at urban, suburban and rural background sites in the region of Paris (France). Atmospheric Chemistry and Physics, 13(15): 7825–7844. doi: 10.5194/acp-13-7825-2013 [4] Burton S P, Ferrare R A, Vaughan M A et al., 2013. Aerosol classification from airborne HSRL and comparisons with the CALIPSO vertical feature mask. Atmospheric Measurement Techniques, 6(5): 1397–1412. doi: 10.5194/amt-6-1397-2013 [5] Calderón-Garcidueñas L, Kulesza R J, Doty R L et al., 2015. Megacities air pollution problems: Mexico City Metropolitan Area critical issues on the central nervous system pediatric impact. Environmental Research, 137: 157–169. doi: 10.1016/j.envres.2014.12.012 [6] Chen Q, Sheng L F, Gao Y et al., 2019. The effects of the trans-regional transport of PM2.5 on a heavy haze event in the pearl river delta in January 2015. Atmosphere, 10(5): 237. doi: 10.3390/atmos10050237 [7] Chen Weiwei, Zhang Shichun, Tong Quansong et al., 2018. Regional characteristics and causes of haze events in Northeast China. Chinese Geographical Science, 28(5): 836–850. doi: 10.1007/s11769-018-0965-3 [8] Coakley J A Jr, Cess R D, 1985. Response of the NCAR community climate model to the radiative forcing by the naturally occurring tropospheric aerosol. Journal of the Atmospheric Sciences, 42(16): 1677–1692. doi: 10.1175/1520-0469(1985)042<1677:ROTNCC>2.0.CO;2 [9] Csavina J, Field J, Félix O et al., 2014. Effect of wind speed and relative humidity on atmospheric dust concentrations in semi-arid climates. Science of the Total Environment, 487: 82–90. doi: 10.1016/j.scitotenv.2014.03.138 [10] Duan J C, Guo S J, Tan J H et al., 2012. Characteristics of atmospheric carbonyls during haze days in Beijing, China. Atmospheric Research, 114-115: 17–27. doi: 10.1016/j.atmosres.2012.05.010 [11] Fan J W, Wang Y, Rosenfeld D et al., 2016. Review of aerosol-cloud interactions: mechanisms, significance, and challenges. Journal of the Atmospheric Sciences, 73(11): 4221–4252. doi: 10.1175/JAS-D-16-0037.1 [12] Fu Bojie, Pan Naiqing, 2016. Integrated studies of physical geography in China: review and prospects. Journal of Geographical Sciences, 26(7): 771–790. doi: 10.1007/s11442-016-1298-8 [13] Fu G Q, Xu W Y, Yang R F et al., 2014. The distribution and trends of fog and haze in the North China Plain over the past 30 years. Atmospheric Chemistry and Physics, 14(21): 11949–11958. doi: 10.5194/acp-14-11949-2014 [14] Goff J A, 1957. Saturation Pressure of Water on the New Kelvin Temperature Scale, Transactions of the American Society of Heating and Ventilating Engineers. Canada: General Books LLC, 347-354. [15] Goyal P, Rama Krishna T V B P S, 2002. Dispersion of pollutants in convective low wind: a case study of Delhi. Atmospheric Environment, 36(12): 2071–2079. doi: 10.1016/S1352-2310(01)00458-7 [16] Guo H, Ling Z H, Cheng H R et al., 2017a. Tropospheric volatile organic compounds in China. Science of the Total Environment, 574: 1021–1043. doi: 10.1016/j.scitotenv.2016.09.116 [17] Guo J P, Deng M J, Lee S S et al., 2016. Delaying precipitation and lightning by air pollution over the Pearl River Delta. Part I: observational analyses. Journal of Geophysical Research: Atmospheres, 121(11): 6472–6488. doi: 10.1002/2015JD023257 [18] Guo J P, Su T N, Li Z Q et al., 2017b. Declining frequency of summertime local-scale precipitation over eastern China from 1970 to 2010 and its potential link to aerosols. Geophysical Research Letters, 44(11): 5700–5708. doi: 10.1002/2017GL073533 [19] Guo J P, Zhang X Y, Cao C X et al., 2010. Monitoring haze episodes over the Yellow Sea by combining multisensor measurements. International Journal of Remote Sensing, 31(17-18): 4743–4755. doi: 10.1080/01431161.2010.485213 [20] Huang X J, Zhang J K, Luo B et al., 2018. Water-soluble ions in PM2.5 during spring haze and dust periods in Chengdu, China: variations, nitrate formation and potential source areas. Environmental Pollution, 243: 1740–1749. doi: 10.1016/j.envpol.2018.09.126 [21] Jacob D J, Winner D A, 2009. Effect of climate change on air quality. Atmospheric Environment, 43(1): 51–63. doi: 10.1016/j.atmosenv.2008.09.051 [22] Kalnay E, Kanamitsu M, Kistler R et al., 1996. The NCEP/NCAR 40-year reanalysis project. Bulletin of the American Meteorological Society, 77(3): 437–472. doi: 10.1175/1520-0477(1996)077<0437:TNYRP>2.0.CO;2 [23] Kanakidou M, Mihalopoulos N, Kindap T et al., 2011. Megacities as hot spots of air pollution in the East Mediterranean. Atmospheric Environment, 45(6): 1223–1235. doi: 10.1016/j.atmosenv.2010.11.048 [24] Kaufman Y J, Justice C O, Flynn L P et al., 1998. Potential global fire monitoring from EOS-MODIS. Journal of Geophysical Research: Atmospheres, 103(D24): 32215–32238. doi: 10.1029/98JD01644 [25] Ke H B, Gong S L, He J J et al., 2019. Spatial and temporal distribution of open bio-mass burning in China from 2013 to 2017. Atmospheric Environment, 210: 156–165. doi: 10.1016/j.atmosenv.2019.04.039 [26] Knippertz P, Evans M J, Field P R et al., 2015. The possible role of local air pollution in climate change in West Africa. Nature Climate Change, 5(9): 815–822. doi: 10.1038/nclimate2727 [27] Langford A O, Senff C J, Alvarez II R J et al., 2010. Long-range transport of ozone from the Los Angeles Basin: a case study. Geophysical Research Letters, 37(6): L06807. doi: 10.1029/2010GL042507 [28] Lanzi E, Dellink R, 2019. Economic Interactions Between Climate Change and Outdoor Air Pollution. OECD Environment Working Papers. doi: 10.1787/8e4278a2-en [29] Lee S, Kim J, Choi M et al., 2019. Analysis of long-range transboundary transport (LRTT) effect on Korean aerosol pollution during the KORUS-AQ campaign. Atmospheric Environment, 204: 53–67. doi: 10.1016/j.atmosenv.2019.02.020 [30] Li L L, Tan Q W, Zhang Y H et al., 2017. Characteristics and source apportionment of PM2.5 during persistent extreme haze events in Chengdu, southwest China. Environmental Pollution, 230: 718–729. doi: 10.1016/j.envpol.2017.07.029 [31] Li Q, Zhang R H, Wang Y, 2016. Interannual variation of the wintertime fog-haze days across central and eastern China and its relation with East Asian winter monsoon. International Journal of Climatology, 36(1): 346–354. doi: 10.1002/joc.4350 [32] Li W G, Liu X G, Zhang Y H et al., 2018. Characteristics and formation mechanism of regional haze episodes in the Pearl River Delta of China. Journal of Environmental Sciences, 63: 236–249. doi: 10.1016/j.jes.2017.03.018 [33] Liao T T, Wang S, Ai J et al., 2017. Heavy pollution episodes, transport pathways and potential sources of PM2.5 during the winter of 2013 in Chengdu (China). Science of the Total Environment, 584-585: 1056–1065. doi: 10.1016/j.scitotenv.2017.01.160 [34] Liao T T, Gui K, Jiang W T et al., 2018. Air stagnation and its impact on air quality during winter in Sichuan and Chongqing, southwestern China. Science of the Total Environment, 635: 576–585. doi: 10.1016/j.scitotenv.2018.04.122 [35] Liao W J, Zhou J B, Zhu S J et al., 2020. Characterization of aerosol chemical composition and the reconstruction of light extinction coefficients during winter in Wuhan, China. Chemosphere, 241: 125033. doi: 10.1016/j.chemosphere.2019.125033 [36] Lin C G, Yang K, Huang J P et al., 2015. Impacts of wind stilling on solar radiation variability in China. Scientific Reports, 5: 15135. doi: 10.1038/srep15135 [37] Liu F, Tan Q W, Jiang X et al., 2019a. Effects of relative humidity and PM2.5 chemical compositions on visibility impairment in Chengdu, China. Journal of Environmental Sciences, 86: 15–23. doi: 10.1016/j.jes.2019.05.004 [38] Liu N, Zhou S, Liu C S et al., 2019b. Synoptic circulation pattern and boundary layer structure associated with PM2.5 during wintertime haze pollution episodes in Shanghai. Atmospheric Research, 228: 186–195. doi: 10.1016/j.atmosres.2019.06.001 [39] Liu X G, Li J, Qu Y et al., 2013. Formation and evolution mechanism of regional haze: a case study in the megacity Beijing, China. Atmospheric Chemistry and Physics, 13(9): 4501–4514. doi: 10.5194/acp-13-4501-2013 [40] Luo J Q, Zhang J K, Huang X J et al., 2020. Characteristics, evolution, and regional differences of biomass burning particles in the Sichuan Basin, China. Journal of Environmental Sciences, 89: 35–46. doi: 10.1016/j.jes.2019.09.015 [41] Ma Siqi, Chen Weiwei, Zhang Shichun et al., 2017. Characteristics and cause analysis of heavy haze in Changchun City in Northeast China. Chinese Geographical Science, 27(6): 989–1002. doi: 10.1007/s11769-017-0922-6 [42] Maji K J, Arora M, Dikshit A K, 2017. Burden of disease attributed to ambient PM2.5 and PM10 exposure in 190 cities in China. Environmental Science and Pollution Research, 24(12): 11559–11572. doi: 10.1007/s11356-017-8575-7 [43] MEP (Ministry of Environmental Protection of People’s Republic of China), 2012. HJ 633-2012 Technical regulation on ambient air quality index (on trial). Beijing: China Environmental Science Press. (in Chinese) [44] Miao Y C, Li J, Miao S G et al., 2019. Interaction between planetary boundary layer and PM2.5 pollution in megacities in China: a review. Current Pollution Reports, 5(4): 261–271. doi: 10.1007/s40726-019-00124-5 [45] Mielonen T, Arola A, Komppula M et al., 2009. Comparison of CALIOP level 2 aerosol subtypes to aerosol types derived from AERONET inversion data. Geophysical Research Letters, 36(18): L18804. doi: 10.1029/2009GL039609 [46] Molteni F, Buizza R, Palmer T N et al., 1996. The ECMWF ensemble prediction system: methodology and validation. Quarterly Journal of the Royal Meteorological Society, 122(529): 73–119. doi: 10.1002/qj.49712252905 [47] Ning G C, Wang S G, Yim S H L et al., 2018. Impact of low-pressure systems on winter heavy air pollution in the northwest Sichuan Basin, China. Atmospheric Chemistry and Physics, 18(18): 13601–13615. doi: 10.5194/acp-18-13601-2018 [48] Park R J, Jacob D J, Kumar N et al., 2006. Regional visibility statistics in the United States: natural and transboundary pollution influences, and implications for the Regional Haze Rule. Atmospheric Environment, 40(28): 5405–5423. doi: 10.1016/j.atmosenv.2006.04.059 [49] Rastak N, Silvergren S, Zieger P et al., 2014. Seasonal variation of aerosol water uptake and its impact on the direct radiative effect at Ny-Ålesund, Svalbard. Atmospheric Chemistry and Physics, 14(14): 7445–7460. doi: 10.5194/acp-14-7445-2014 [50] Rodgers J L, Nicewander W A, 1988. Thirteen ways to look at the correlation coefficient. The American Statistician, 42(1): 59–66. doi: 10.2307/2685263 [51] Rosenfeld D, Sherwood S, Wood R et al., 2014. Climate effects of aerosol-cloud interactions. Science, 343(6169): 379–380. doi: 10.1126/science.1247490 [52] San José R, Luis Pérez J, Pérez L et al., 2018. Effects of climate change on the health of citizens modelling urban weather and air pollution. Energy, 165: 53–62. doi: 10.1016/j.energy.2018.09.088 [53] Sarkodie S A, Owusu P A, Leirvik T, 2020. Global effect of urban sprawl, industrialization, trade and economic development on carbon dioxide emissions. Environmental Research Letters, 15(3): 034049. doi: 10.1088/1748-9326/ab7640 [54] Schroeder W, Oliva P, Giglio L et al., 2014. The New VIIRS 375 m active fire detection data product: algorithm description and initial assessment. Remote Sensing of Environment, 143: 85–96. doi: 10.1016/j.rse.2013.12.008 [55] Shaffer R M, Sellers S P, Baker M G et al., 2019. Improving and expanding estimates of the global burden of disease due to environmental health risk factors. Environmental Health Perspectives, 127(10): 105001. doi: 10.1289/EHP5496 [56] Shao P Y, Tian H Z, Sun Y J et al., 2018. Characterizing remarkable changes of severe haze events and chemical compositions in multi-size airborne particles (PM1, PM2.5 and PM10) from January 2013 to 2016-2017 winter in Beijing, China. Atmospheric Environment, 189: 133–144. doi: 10.1016/j.atmosenv.2018.06.038 [57] Sheng J J, Zhao D L, Ding D P et al., 2018. Characterizing the level, photochemical reactivity, emission, and source contribution of the volatile organic compounds based on PTR-TOF-MS during winter haze period in Beijing, China. Atmospheric Research, 212: 54–63. doi: 10.1016/j.atmosres.2018.05.005 [58] Shepard D, 1968. A two-dimensional interpolation function for irregularly-spaced data. In: Proceedings of the 1968 23rd ACM National Conference. Washington DC: Association for Computing Machinery, 517-524. doi: 10.1145/800186.810616 [59] Shi P J, Zhang G F, Kong F et al., 2019. Variability of winter haze over the Beijing-Tianjin-Hebei region tied to wind speed in the lower troposphere and particulate sources. Atmospheric Research, 215: 1–11. doi: 10.1016/j.atmosres.2018.08.013 [60] Stein A F, Draxler R R, Rolph G D et al., 2015. NOAA’s HYSPLIT atmospheric transport and dispersion modeling system. Bulletin of the American Meteorological Society, 96(12): 2059–2077. doi: 10.1175/bams-d-14-00110.1 [61] Sun Y L, Jiang Q, Wang Z F et al., 2014. Investigation of the sources and evolution processes of severe haze pollution in Beijing in January 2013. Journal of Geophysical Research: Atmospheres, 119(7): 4380–4398. doi: 10.1002/2014JD021641 [62] Tainio M, Andersen Z J, Nieuwenhuijsen M J et al., 2021. Air pollution, physical activity and health: a mapping review of the evidence. Environment International, 147: 105954. doi: 10.1016/j.envint.2020.105954 [63] Tao J, Zhang L M, Engling G et al., 2013. Chemical composition of PM2.5 in an urban environment in Chengdu, China: importance of springtime dust storms and biomass burning. Atmospheric Research, 122: 270–283. doi: 10.1016/j.atmosres.2012.11.004 [64] Tiwari S, Hopke P K, Pipal A S et al., 2015. Intra-urban variability of particulate matter (PM2.5 and PM10) and its relationship with optical properties of aerosols over Delhi, India. Atmospheric Research, 166: 223–232. doi: 10.1016/j.atmosres.2015.07.007 [65] Venegas L E, Mazzeo N A, 1999. Atmospheric stagnation, recirculation and ventilation potential of several sites in Argentina. Atmospheric Research, 52(1–2): 43–57. doi: 10.1016/S0169-8095(99)00030-7 [66] Wang H, Xu J Y, Zhang M et al., 2014. A study of the meteorological causes of a prolonged and severe haze episode in January 2013 over central-eastern China. Atmospheric Environment, 98: 146–157. doi: 10.1016/j.atmosenv.2014.08.053 [67] Wang H B, Tian M, Chen Y et al., 2018a. Seasonal characteristics, formation mechanisms and source origins of PM2.5 in two megacities in Sichuan Basin, China. Atmospheric Chemistry and Physics, 18(2): 865–881. doi: 10.5194/acp-18-865-2018 [68] Wang X Y, Dickinson R E, Su L Y et al., 2018b. PM2.5 pollution in China and how it has been exacerbated by terrain and meteorological conditions. Bulletin of the American Meteorological Society, 99(1): 105–119. doi: 10.1175/BAMS-D-16-0301.1 [69] Wei W, Li Y, Wang Y T et al., 2018. Characteristics of VOCs during haze and non-haze days in Beijing, China: concentration, chemical degradation and regional transport impact. Atmospheric Environment, 194: 134–145. doi: 10.1016/j.atmosenv.2018.09.037 [70] Whiteman C D, Hoch S W, Horel J D et al., 2014. Relationship between particulate air pollution and meteorological variables in Utah’s Salt Lake Valley. Atmospheric Environment, 94: 742–753. doi: 10.1016/j.atmosenv.2014.06.012 [71] Wu P, Huang X J, Zhang J K et al., 2019. Characteristics and formation mechanisms of autumn haze pollution in Chengdu based on high time-resolved water-soluble ion analysis. Environmental Science and Pollution Research, 26(3): 2649–2661. doi: 10.1007/s11356-018-3630-6 [72] Wyatt L H, Peterson G C L, Wade T J et al., 2020. The contribution of improved air quality to reduced cardiovascular mortality: declines in socioeconomic differences over time. Environment International, 136: 105430. doi: 10.1016/j.envint.2019.105430 [73] Xie J L, Liao Z H, Fang X Q et al., 2019. The characteristics of hourly wind field and its impacts on air quality in the Pearl River Delta region during 2013–2017. Atmospheric Research, 227: 112–124. doi: 10.1016/j.atmosres.2019.04.023 [74] Yang Z M, Zdanski C, Farkas D et al., 2020. Evaluation of Aerosol Optical Depth (AOD) and PM2.5 associations for air quality assessment. Remote Sensing Applications: Society and Environment, 20: 100396. doi: 10.1016/j.rsase.2020.100396 [75] Ye Yu, Li Xiuyang, Chen Kun et al., 2011. Association of aerosol optical depth with air pollutants and meteorological factors: a time series analysis. Climatic and Environmental Research, 2011, 16(2): 169–174. (in Chinese) [76] Yin P, Guo J P, Wang L J et al., 2020. Higher risk of cardiovascular disease associated with smaller size-fractioned particulate matter. Environmental Science & Technology Letters, 7(2): 95–101. doi: 10.1021/acs.estlett.9b00735 [77] Ying M, Zhang W, Yu H et al., 2014. An overview of the China Meteorological Administration Tropical Cyclone Database. Journal of Atmospheric & Oceanic Technology, 31(2): 287–301. doi: 10.1175/JTECH-D-12-00119.1 [78] Zhang Jinming, Guo Liping, Zhang Xiaodan, 2012. Effects of interpolation parameters in inverse distance weighted method on DEM accuracy. Journal of Geomatics Science and Technology, 29(1): 51–56. (in Chinese) [79] Zhang Renhe, Li Qiang, Zhang Ruonan, 2014. Meteorological conditions for the persistent severe fog and haze event over eastern China in January 2013. Science China Earth Sciences, 57(1): 26–35. doi: 10.1007/s11430-013-4774-3 [80] Zhang Z, Zhang X, Gong D et al., 2016. Possible influence of atmospheric circulations on winter haze pollution in the Beijing-Tianjin-Hebei region, northern China. Atmospheric Chemistry and Physics, 16(2): 561–571. doi: 10.5194/acp-16-561-2016 [81] Zhu L L, Zhang Y H, Kan X et al., 2018. Transport paths and identification for potential sources of haze pollution in the Yangtze River delta urban agglomeration from 2014 to 2017. Atmosphere, 9(12): 502. doi: 10.3390/atmos9120502 -

 点击查看大图

计量
- 文章访问数: 162
- HTML全文浏览量: 21
- PDF下载量: 20
- 被引次数: 0


