


-
High mountainous regions are main sources of water supply to downstream areas (Viviroli and Weingartner, 2004; Marques et al., 2011), accurate estimates of precipitation are fundamental for hydrometeorological and ecohydrological studies, and then for successful water resources management and planning in these areas (Tapiador et al., 2012; Beck et al., 2017; Worqlul et al., 2017; Sun et al., 2018). However, in high mountainous areas, precipitation varies strongly over space because of the high elevation and complex terrain, leading to more difficulties and uncertainties in areal precipitation estimation (Meng et al., 2014; Tong et al., 2014; Essou et al., 2016; Worqlul et al., 2017; Henn et al., 2018).
Generally, precipitation datasets can be classified into three groups: gauge observations, satellite products, and reanalysis products (Bitew and Gebremichael, 2011; Tapiador et al., 2012; Ma et al., 2018). Gauge observations are typical measurements to directly observe precipitation at the Earth’s surface, but difficult to derive areal precipitation because of the poor weather station density and uneven spatial distribution in mountainous areas (Tapiador et al., 2012; Zhang et al., 2016; Worqlul et al., 2017; Sun et al., 2018). Satellite-based precipitation products can provide global, homogeneous precipitation estimations by different deriving methods corresponding to different satellite sensors (Sun et al., 2018), but they would lead large uncertainty in related analysis because of their biases of precipitation amount and false detections of precipitation events (Bitew and Gebremichael, 2011; Essou et al., 2016; Ma et al., 2018). With significant improvements in numerical models, a number of reanalysis precipitation products have provided spatially variant precipitation data by merging model outputs and gauge observations (Simmons et al., 2007; Rienecker et al., 2008). However, the coarse resolutions (250–600 km) and unneglectable biases of reanalysis products limited their suitability in hydrometeorological studies (Tapiador et al., 2012; Essou et al., 2016; Nkiaka et al., 2017; Li et al., 2018; Sun et al., 2018). Dynamical downscaling of reanalysis products through Regional Climate Models (RCMs) would provide finer information and significantly increase their performance in precipitation estimations and hydrological simulations (Chen et al., 2013; Seyyedi et al., 2014).
Differing in data sources, quality control schemes, and estimation procedures, the above precipitation datasets differ in precipitation amount and spatial pattern (Henn et al., 2018; Sun et al., 2018). Numerous research papers have evaluated and compared different precipitation datasets around the world to provide essential information for related studies (Nkiaka et al., 2017; Worqlul et al., 2017; Henn et al., 2018; Sun et al., 2018; Zhu et al., 2018), but only a few researches compared the performance of satellite products and reanalysis products, seldom focusing on high mountainous area (Thiemig et al., 2013; Seyyedi et al., 2014; Tong et al., 2014; Beck et al., 2017; Li et al., 2018).
To take advantage of the best available data, the primary trend is to merge different precipitation datasets regardless of source (Beck et al., 2017), and bias correction is the most popular way to merge estimations and gauge observations (Behrangi et al., 2011; Bitew and Gebremichael, 2011; Essou et al., 2016; Beck et al., 2017; Chen et al., 2018). There are lots of bias correction approaches proposed by previous studies at different tempo-spatial scales, however, their performance would be limited by data scarcity caused by sparse and uneven observations, and strong variability of precipitation in arid high mountainous area (Maurer et al., 2013; Nguyen et al., 2017). Meanwhile, all the bias correction methods can robustly correct the mean and standard deviation of daily precipitation, but the correction of skewness and kurtosis of daily precipitation are much more sensitive to the bias correction method (Lafon et al., 2013). Therefore, because of data scarcity in mountainous area, the simple linear bias correction method has been applied to remove the systematical errors of precipitation estimates in this study, and its performance requires to be evaluated. Moreover, there would be uncertainty caused by data scarcity in the evaluations through direct comparison with the ground observation station network, thus it is a necessary to evaluate precipitation datasets through hydrological simulations to provide a more robust understanding about the performance of precipitation datasets (Worqlul et al., 2017; Zhu et al., 2018).
In this study, the satellite precipitation product, Tropical Rainfall Measuring Mission (TRMM) Multisatellite Precipitation Analysis (TMPA) product, has been selected because it has been widely used around the world (Beck et al., 2017; Worqlul et al., 2017; Darand et al., 2017). The NCEP’s Final Analysis (FNL) data, downscaled by the Weather Research and Forecasting (WRF) model (hereafter is called ‘the WRF output’), has also been selected because of its reliable performance in high mountainous areas (Pan et al., 2012). The study area is the upper reach of the Heihe River Watershed, located in the middle Qilian Mountain, Northwest China. This study conducts bias correction of both the WRF output and the TMPA product, and evaluates and compares both two raw datasets and two bias-corrected datasets. This study discusses: 1) comparing the satellite product and downscaled reanalysis product, which one is more suitable in high mountainous areas? and 2) to what extent would simple linear bias-correction method improve the performance of precipitation datasets in arid high mountainous areas? The results would provide fundamental to successful water resources management and planning in arid high mountainous areas.
-
The upper reach of the Heihe River Watershed is located in the middle Qilian Mountain (Fig. 1), and has got a lot of attentions because of its representativeness of high mountainous area. It is with a length of 313 km and a drainage area of 10 009 km2, producing the majority of runoff for the entire Heihe River Watershed (Zhang et al., 2019). In the upper reach, the annual mean temperature ranges from –3.1℃ to 3.6℃ with the minimum temperature of –28.0℃. Mean annual precipitation ranges from 250 mm below 1900 m asl (above sea level) to 700 mm above 3600 m asl, and most precipitation (over 60%) falls between June and September (Li et al., 2009a). The elevation in the region ranges from 1674 to 5584 m asl (Li et al., 2009a), and the annual mean temperature decreases with increasing elevation (from 6.2℃ to −9.6℃), while the mean annual precipitation increases with increasing elevation (from 250 mm below 1900 m asl elevation range to 700 mm above 3600 m asl range) (Zhao et al., 2005).

Figure 1. Map of the middle Qilian Mountain, Northwest China
-
The gauge precipitation data are obtained from the National Meteorological Information Center of China (NMIC) at daily step around the upper reach of the Heihe River Watershed. As there are only four weather stations located within the study area, five more adjacent weather stations within 50 km from the watershed were also selected in this study (Fig. 1) (Zhang et al., 2016).
Forced by FNL data, the WRF simulations were carried out by WRF V3.1 system through two-way nested computation (Pan et al., 2012). The WRF output is with a horizontal resolution of 0.05° × 0.05° at hourly step. Validated by daily observed data of temperature, the output has good agreement with the observed data with coefficient of determination (r2) more than 0.93 and absolute of mean bias error less than 2.0℃ (Detailed information can be found in Pan et al., 2012). However, the precipitation dataset still requires validation.
The TMPA product is based on the calibration by the TRMM Combined Instrument (TCI) and TRMM Microwave Imager (TMI) precipitation products, respectively (Huffman et al., 2007). The post real-time research version (3B42) uses monthly rain gauge data for bias adjustment in the research product, and its latest version TMPA 3B42 V7 (hereafter is called ‘the TMPA product’) at daily temporal and 0.25° × 0.25° spatial scales over the latitude band 50° N–50° S is applied in this study (
http://trmm.gsfc.nasa.gov , Huffman and Bolvin, 2018).In this study, precipitation from gauge observations, the WRF output and the TMPA product are all from 1 January, 2000 to 31 December, 2010. To be fairly compared, hourly precipitation values of the WRF output were aggregated into daily values.
-
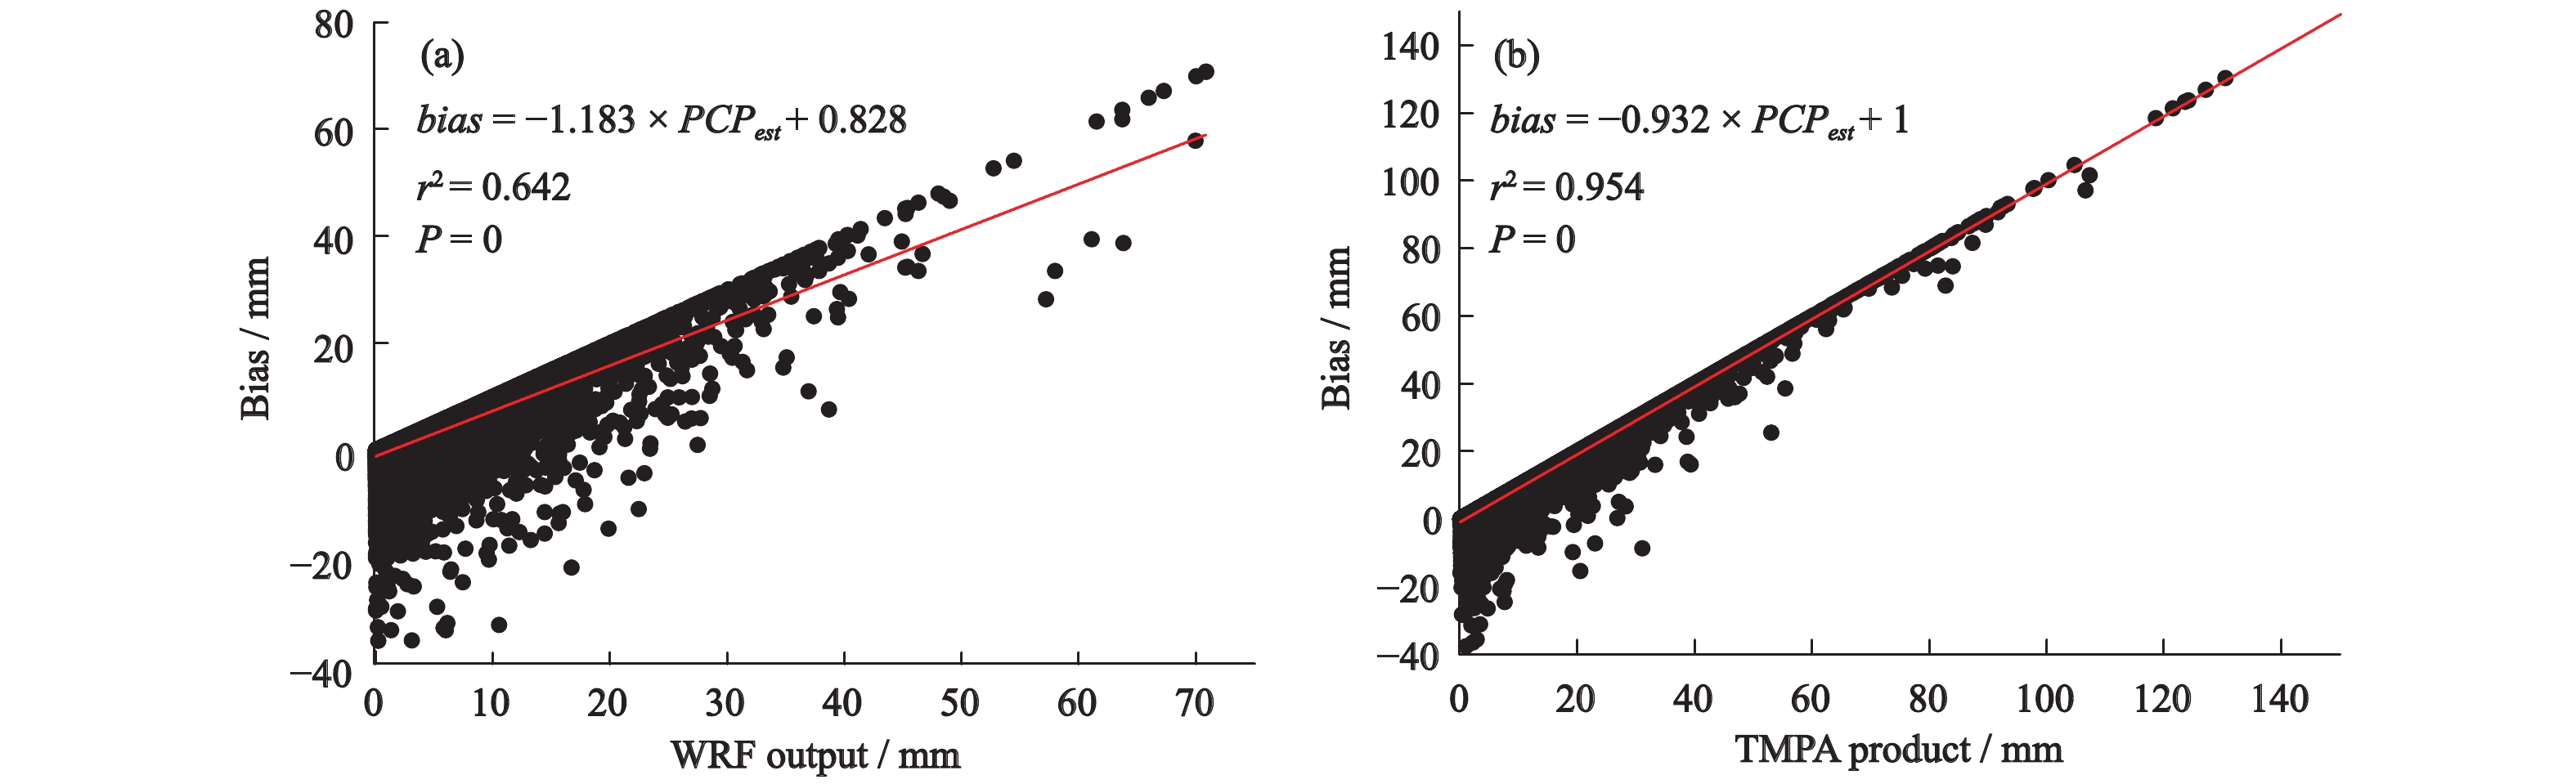
Bias is determined as the differences between observed precipitation (PCPobs) and estimated precipitation (PCPest) from both the WRF output and the TMPA product. In the study area, the correlation coefficients (r) is 0.821 between bias and PCPest and is –0.350 between bias and PCPobs for the WRF output, while they are 0.977 and –0.217 for the TMPA product. All of them are significant. The r between bias and PCPest are more significant than those between bias and PCPobs, indicating that bias is more correlated to PCPest. Moreover, the linear equations were applied to fit bias and PCPest for both the WRF output and the TMPA product. As shown in Fig. 2, r2 are 0.642 and 0.954 for the linear fitting equations of the WRF output and the TMPA product respectively, indicating higher goodness-of-fit of both equations. The P-values of F-test (significance F values) are zero for both linear fitting equations and pass the significance test (less than 0.05), indicating that both equations are significantly reliable and effective. Thus, it is convincing that the relationships between bias and PCPest are linear for both the WRF output and the TMPA product.

Figure 2. Scatterplots of biases and the precipitation values in the upper reach of the Heihe River Watershed. (a) The WRF (Weather Research and Forecasting) output, (b) The TMPA (Tropical Rainfall Measuring Mission (TRMM) Multisatellite Precipitation Analysis) product
In this study, at each gauge station, the grid in which the station is located was selected as its corresponding grid. Bias was obtained by data at each meteorological station and its corresponding grid, then the linear equations of bias and PCPest were established through stepwise regression method by using the data series with non-zero PCPest
values from 2000 to 2010. Finally, two precipitation datasets, bias-corrected WRF output and bias-corrected TMPA product, were obtained by PCPest -bias. -
Against the gauge dataset, four indicators were used to measure the performance of different precipitation datasets in fitting the observations at daily step (Behrangi et al., 2011; Meng et al., 2014): the ratio of root-mean-square errors to the observations’ standard deviation (RSR), mean absolute error (MAE), mean of error (ME) and percentage bias (PBIAS). The smaller RSR, MAE, absolute ME and absolute PBIAS values, the better simulations in matching the observation.
To evaluate the correspondence between the estimated and observed occurrence of precipitation events, three statistics were used in this study (Ghajarnia et al., 2015; Tang et al., 2016): probability of detection (POD), false alarm ratio (FAR) and critical success index (CSI). POD measures the fraction of observed events that were correctly diagnosed
$ \left(\dfrac{{hits}}{{hits + {{misses}}}}\right)$ , FAR provides the fraction of diagnosed events that were actually ‘falseAlarms’$\left(\dfrac{{falseAlarm{{s}}}}{{hits + falseAlarms}}\right)$ , while CSI gives the overall fraction of events correctly diagnosed by each dataset$\left(\dfrac{{hits}}{{hits + misses + falseAlarms}}\right)$ . In which, ‘hits’ indicates the times that both the estimated dataset and gauge observation detect precipitation events, ‘falseAlarms’ refers to the number of times that the estimated dataset identifies precipitation but the gauge observation does not, and ‘misses’ refers to the number of precipitation events during the study period that the gauge observation classifies them as precipitation but the estimated dataset does not. All the three statistics range from 0 to 1, with perfection represented by a POD of 1, a FAR of 0 and a CSI of 1.In this study, the evaluations against gauge observations have been carried on both at point scale and watershed scale. At point scale, the WRF output and the TMPA product are compared against the observations of each gauge station located in the corresponding grid. At watershed scale, both the WRF output and the TMPA product, as well as gauge observations, were processed into daily watershed average values by arithmetic average method to avoid the impacts of different spatial resolutions.
-
SWAT shows reliable performance in the applications in the upper reach of the Heihe River Watershed (Zhang et al., 2016), and the datasets used for its setup in this study are listed in Table 1. To be fairly compared, in different simulations, only precipitation datasets differ and the other meteorological inputs are the same in this study. For all the precipitation datasets, the warm up period was 2000-01-01 to 2000-12-31, the calibration period was 2001-01-01 to 2007-12-31 and the validation period was 2008-01-01 to 2010-12-31. The details of model calibration can be found in Zhang et al. (2016).
Table 1. Major datasets used in the initial setup of the SWAT in the upper reach of the Heihe River Watershed
Data Resolution Period Source agency Precipitation (gauge observations) Daily, nine stations 2000–2010 The National Meteorological Center of China (NMCC) Precipitation (WRF output) Hourly, 0.05° × 0.05° 2000–2010 Environmental & Ecological Science Data Center for West China, National
Natural Science Foundation of China (http://westdc.westgis.ac.cn )Precipitation (bias-corrected WRF output) Daily, 0.05° × 0.05° 2000–2010 This study Precipitation (TMPA product) Daily, 0.25° × 0.25° 2000–2010 National Aeronautics and Space Administration
(https://pmm.nasa.gov/index.php?q=TRMM )Precipitation (bias-corrected TMPA product) Daily, 0.25° × 0.25° 2000–2010 This study Air temperature (maximum, minimum) Daily, nine stations Solar radiation Daily, nine stations 2000–2010 The National Meteorological Center of China (NMCC) Wind Daily, nine stations Relative humidity Daily, nine stations Flow data Daily runoff 2000–2010 DEM 30 m Environmental & Ecological Science Data Center for West China, National Natural Science Foundation of China ( http://westdc.westgis.ac.cn )Soil data 1∶1 000 000 2000 Land use data 1∶100 000 2000 Notes: WRF: Weather Research and Forecasting; TMPA: Tropical Rainfall Measuring Mission (TRMM) Multisatellite Precipitation Analysis; DEM is Digital Elevation Model As different objective functions would yield different evaluation results, four most popular objective functions were used to measure the model performance according to Moriasi et al. (2007) and Zhang et al. (2016): Nash-Sutcliffe efficiency (NSE), r2, RSR and PBIAS. The combination of larger NSE and r2 values, smaller RSR and absolute PBIAS values indicate that the simulation performance is better. In this study, the ratings in evaluating the model performance are very good (NSE ≥ 0.70), good (0.50 ≤ NSE < 0.70), satisfactory (0.30 ≤ NSE < 0.50), unsatisfactory (0 ≤ NSE < 0.30), and unreliable (NSE < 0) (Kalin et al., 2010).
P-factor and R-factor were applied to assess the model uncertainty. The P-factor is the fraction of measured data (plus its error) bracketed by the 95PPU (95% prediction uncertainty) band and varies from 0 to 1, where 1 indicates 100% bracketing of the measured data within model prediction uncertainty (i.e., a perfect model simulation considering the uncertainty). The quantity (1 – P-factor) could hence be referred to as the model error (Abbaspour et al., 2015). The R-factor on the other hand is the ratio of the average width of the 95 PPU band to the standard deviation of the measured variable, the smaller value of R-factor indicates less uncertainty (Abbaspour et al., 2015).
-
As shown in Table 2, at all the gauge stations, the WRF output fits the observations better than the TMPA product with significantly smaller RSR, MAE, absolute ME and PBIAS values. The WRF output overestimates precipitation at all the stations with positive ME and PBIAS values except Tuole and Yeniugou, while the TMPA product significantly overestimates precipitation at all the nine stations with larger positive ME and PBIAS values.
Table 2. Comparison of the precipitation values from different datasets with the gauge observations at daily step in the middle Qilian Mountain, China
Datasets Statistics Linze Tuole Sunan Yeniugou Zhangye Minle Qilian Shandan Yongchang WRF output RSR 1.403 1.125 1.848 1.240 1.701 1.308 1.394 2.414 2.285 MAE / mm 0.452 1.118 1.148 1.546 0.917 1.485 1.713 2.413 2.063 ME / mm 0.140 –0.105 0.577 –0.155 0.485 0.474 0.133 1.783 1.433 PBIAS / % 57.4 –11.0 99.5 –11.7 111.8 52.3 10.7 268.4 209.8 TMPA product RSR 7.350 3.210 5.106 3.028 5.142 3.006 2.954 3.536 3.856 MAE / mm 3.635 3.981 4.096 4.313 3.616 3.707 4.110 3.498 3.425 ME / mm 3.259 2.525 3.211 2.325 2.960 2.241 2.102 2.410 2.323 PBIAS / % 1338.6 264.3 553.4 175.9 681.6 247.2 169.4 362.7 340.1 Bias-corrected WRF output RSR 0.934 0.911 0.915 0.910 0.917 0.934 0.953 0.971 0.965 MAE / mm 0.309 1.056 0.680 1.349 0.540 1.103 1.415 0.945 0.934 ME / mm –0.068 –0.224 –0.113 –0.338 –0.061 –0.119 –0.258 –0.072 –0.059 PBIAS / % –27.7 –23.4 –19.5 –25.5 –14.1 –13.1 –20.8 –10.9 –8.7 Bias-corrected TMPA product RSR 1.012 1.032 1.026 1.039 1.018 1.025 1.040 1.019 1.027 MAE / mm 0.307 1.162 0.705 1.580 0.536 1.111 1.446 0.823 0.824 ME / mm –0.164 –0.583 –0.378 –0.692 –0.287 –0.583 –0.770 –0.414 –0.452 PBIAS / % –67.3 –61.0 –65.1 –52.3 –66.1 –64.3 –62.1 –62.3 –66.2 Notes: RSR refers to the ratio of root-mean-square errors to the observations’ standard deviation, MAE refers to mean absolute error, ME refers to mean of error, PBIAS refers to percentage bias At the watershed scale, the WRF output also fits the observations better than the TMPA product (Table 2). Moreover, the average annual precipitation of the WRF output (604.5 mm/yr) is about three times more than those of gauge observations (201.5 mm/yr), while the TMPA product (1276.4 mm/yr) is about six times. With larger positive ME and PBIAS values, both datasets overestimate precipitation at the watershed scale in the study area, while the TMPA product shows more significant overestimations.
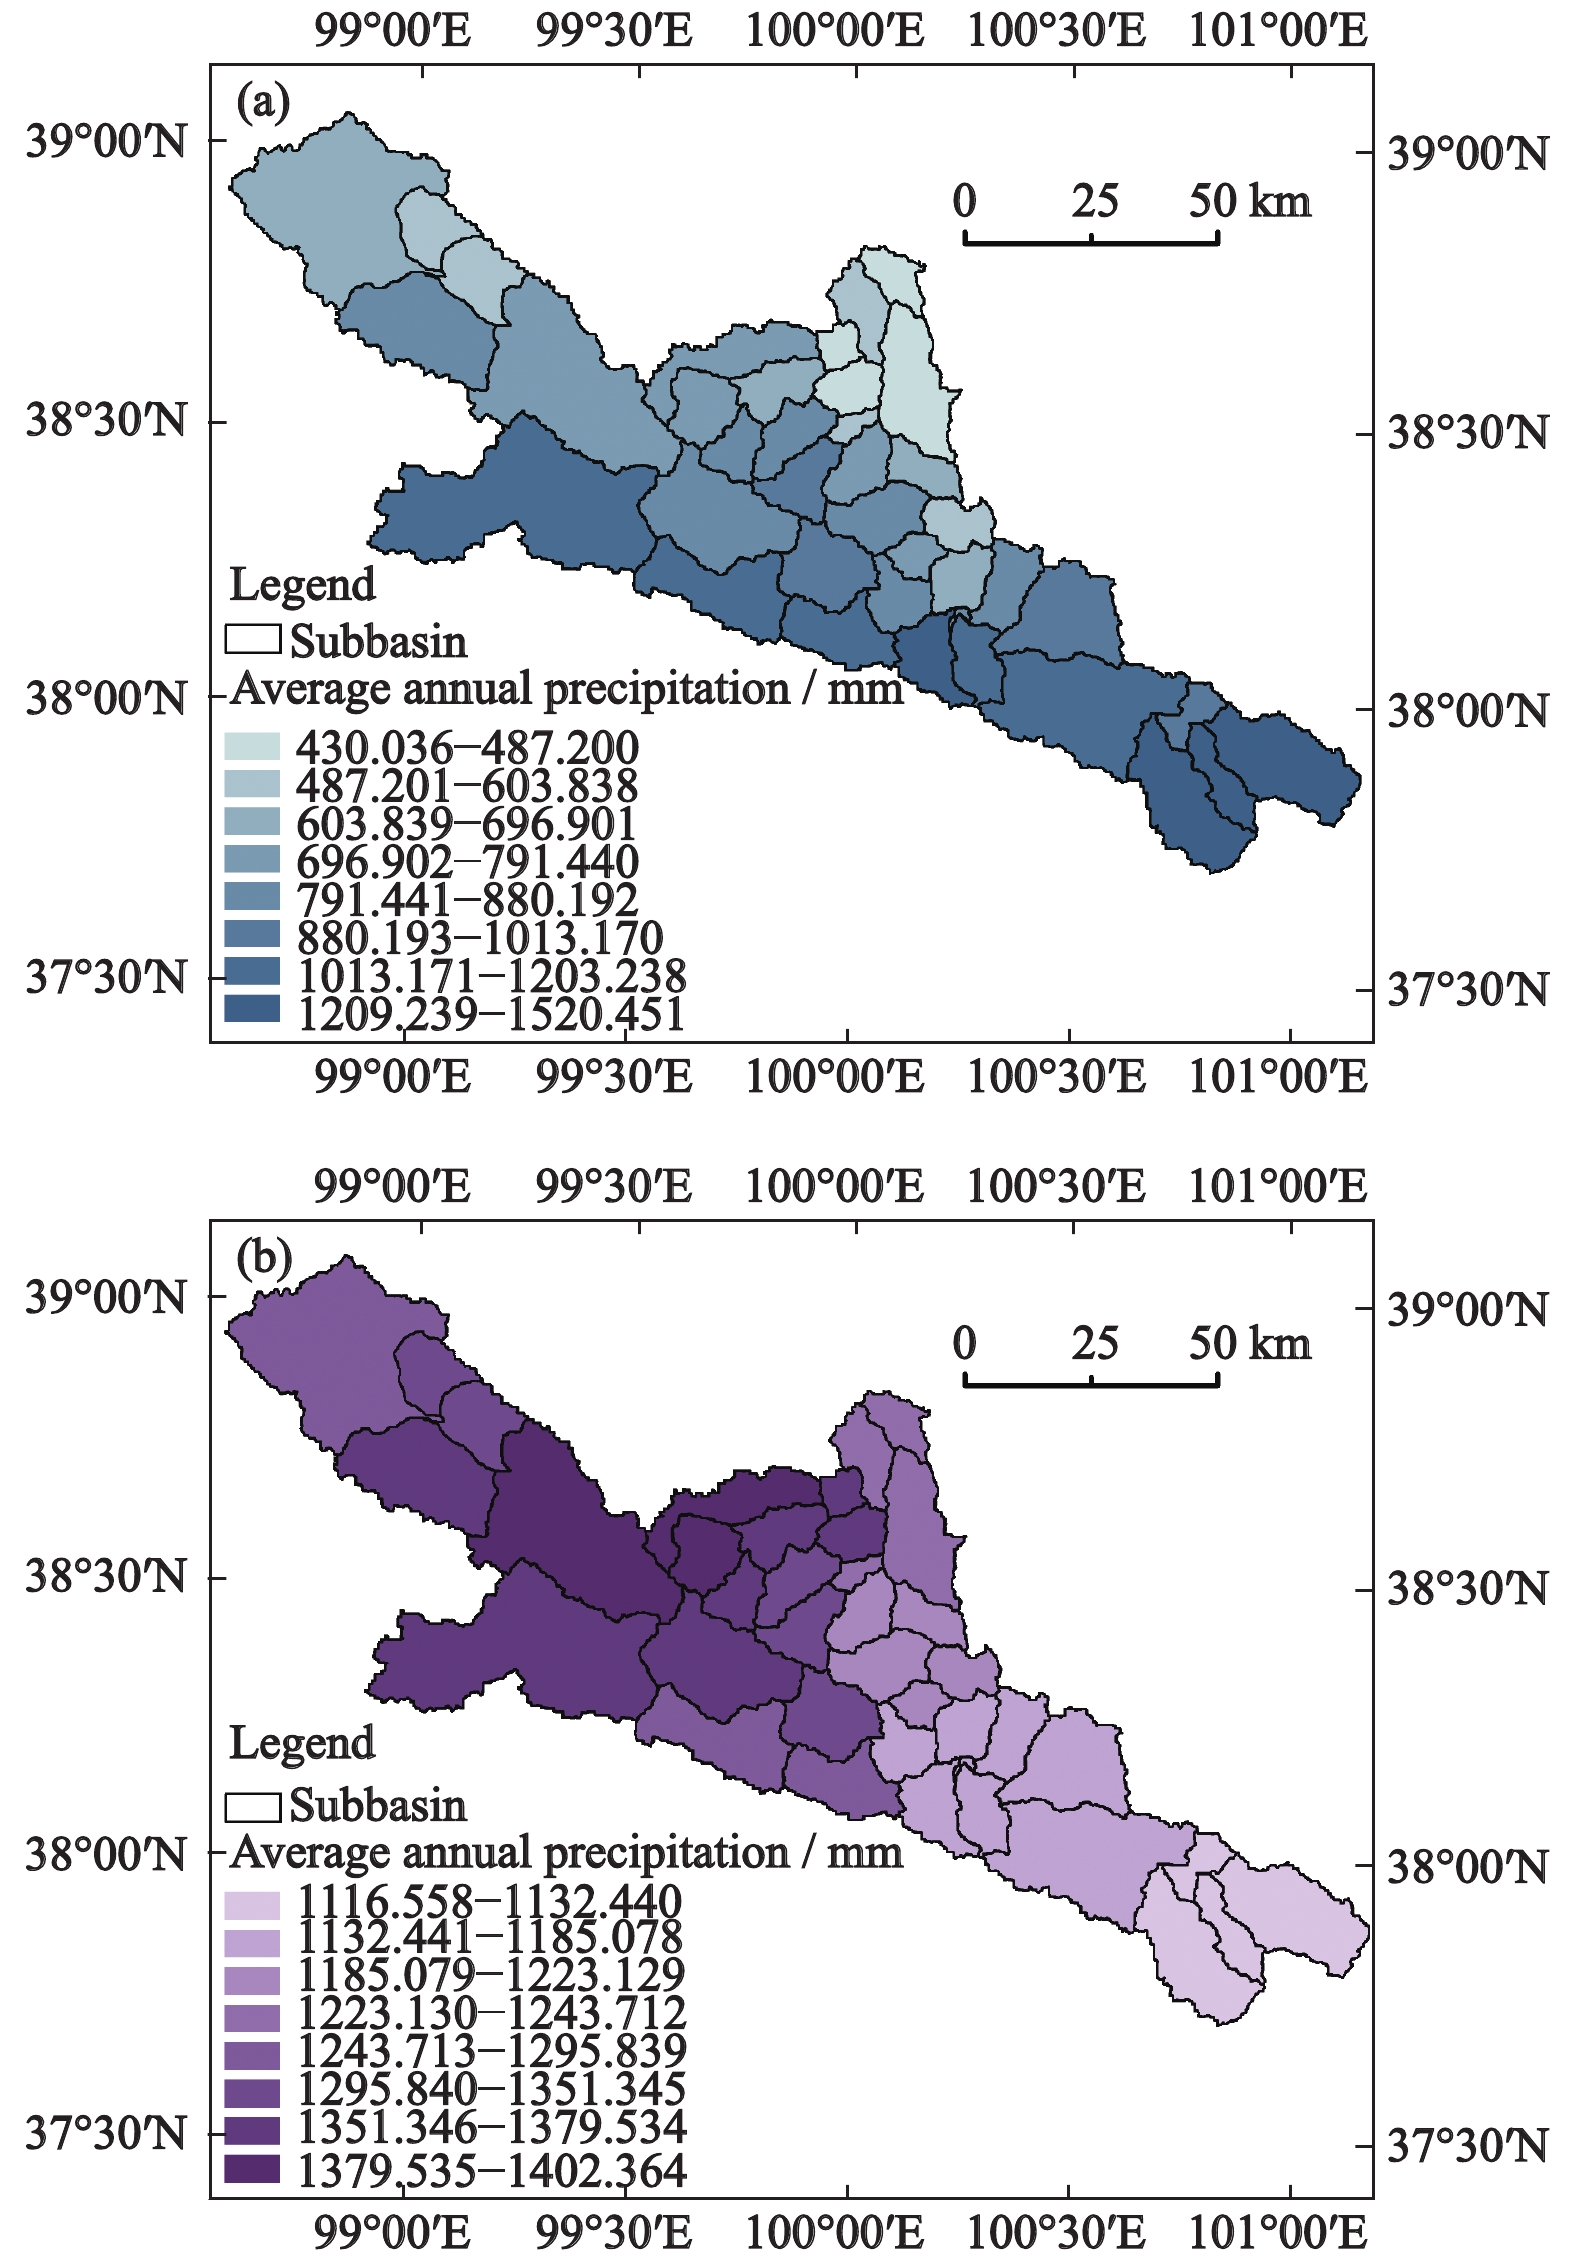
As shown in Fig. 3, the WRF output is drier in the northwest and wetter in the southeast of the study area, while the TMPA product is wetter in the northwest and drier in the southeast. As the precipitation in the study area shows increasing trends from northwest to southeast (Ding et al., 1999), the WRF output better catches the spatial pattern of precipitation in the study area than the TMPA product.

Figure 3. Average annual precipitation of both raw datasets in each subbasin in the upper reach of the Heihe River Watershed. (a) The WRF output, (b) The TMPA product
-
As shown in Fig. 4, with significantly larger POD and CSI values, as well as smaller FAR values, the WRF output performs significantly better in detecting observed precipitation events than the TMPA product. The larger FAR values of the TMPA product indicate that it falsely estimated many precipitation events that the gauge observation showed as no precipitation, leading to the overestimations of the TMPA product. Eliminating the ‘falseAlarms’ events, the RSR, MAE, ME and PBIAS values are 3.314, 2.916 mm, 1.481 mm and 132.5% for the TMPA product, which are notably smaller than those values including ‘falseAlarms’ events.

Figure 4. Contingency analysis at gauge stations. (a) The WRF output, (b) The TMPA product. POD refers to probability of detection, FAR refers to false alarm ratio, CSI refers to critical success index
At seasonal scale, the FAR values of the TMPA product are 0.754, 0.574, 0.760 and 0.898 in spring, summer, autumn and winter, respectively. It shows that the ‘falseAlarms’ events are largest in winter, then in autumn and spring, and finally in summer. The RSR values are 5.718, 2.747, 4.504 and 34.464 including ‘falseAlarms’ events, and are 3.029, 1.836, 2.164 and 9.750 eliminating ‘falseAlarms’ events in spring, summer, autumn and winter, respectively. Thus, the performance difference caused by ‘falseAlarms’ events is largest in winter, then in spring and autumn, and smallest in summer.
For the WRF output, the POD, FAR, and CSI values showed different variation at all the stations (Fig. 4a). However, for the TMPA product, the CSI values showed same variations with the POD values at all the stations (Fig. 4b). As POD is the ratio of ‘hits’ to the sum of ‘hits’ and ‘misses’, and CSI is the ratio of ‘hits’ to the sum of ‘hits’, ‘misses’ and ‘falseAlarms’, the same variation trends of POD and CSI values indicate that the ‘falseAlarms’ of the TMPA product is nearly an areal constant in the study area. It means that there is a systemic error of ‘falseAlarms’ events of the TMPA product in the upper reach of the Heihe River Watershed.
-
To better understand the performance of both the WRF output and the TMPA product in different precipitation ranges respectively, five percentile points of each dataset (Q5, Q25, Q50, Q75, and Q95), were used to divide the overall estimated precipitation range of each dataset into six percentile series (Table 3, Gudmundsson et al., 2012; Ghajarnia et al., 2015; Zhang et al., 2016). As shown in Figs. 5a, 5b, for both the WRF output and the TMPA product, the RSR values increase with the estimated precipitation values increasing. Nevertheless, the WRF output showed better performance with smaller RSR range than the TMPA product.
Table 3. Five percentile points of three precipitation datasets
Percentile points Gauge dataset / mm The WRF output / mm The TMPA product / mm Q5 0.61 0.285 0.597 Q25 4.90 1.589 3.022 Q50 11.70 4.068 7.754 Q75 19.40 9.224 17.462 Q95 30.00 22.642 42.381 Notes: Q5 is 5 percentile, Q25 is 25 percentile, Q50 is 50 percentile, Q75 is 75 percentile, and Q95 is 95 percentile, respectively 
Figure 5. Categorical analysis based on the estimated precipitation datasets. (a) RSR values of the WRF output, (b) RSR values of the TMPA product, (c) POD values of the WRF output, (d) POD values of the TMPA product. Q5, Q25, Q50, Q75, and Q95 are listed in Table 3 for each dataset. RSR refers to the ratio of root-mean-square errors to the observations’ standard deviation, POD refers to probability of detection, FAR refers to false alarm ratio, CSI refers to critical success index
As shown in Figs. 5c, 5d, for both the WRF output and the TMPA product, the POD values are both 1 in the ranges of ≥ Q5, respectively. It means that ‘misses’ events never occur when estimated precipitation values of the WRF output larger than 0.285 mm (≥ Q5), and estimated precipitation values of the TMPA product larger than 0.597 mm (≥ Q5). Thus, the formula of CSI can be simplified as
$\dfrac{{hits}}{{hits + falseAlarms}}$ . As the formula of FAR is$\dfrac{{falseAlarms}}{{hits + falseAlarms}}$ , FAR/CSI equals to falseAlarms/hits for both datasets in the ranges of ≥ Q5, respectively. As shown in Fig. 5, for both datasets, the FAR values are around 0.676–0.787 and the CSI values are around 0.213–0.324 in the ranges of ≥ Q5. Therefore, ‘falseAlarms’ events are over three times more than ‘hits’ events when estimated precipitation values larger than 0.285 mm (≥ Q5) for the WRF output, and estimated precipitation values larger than 0.597 mm (≥ Q5) for the TMPA product. -
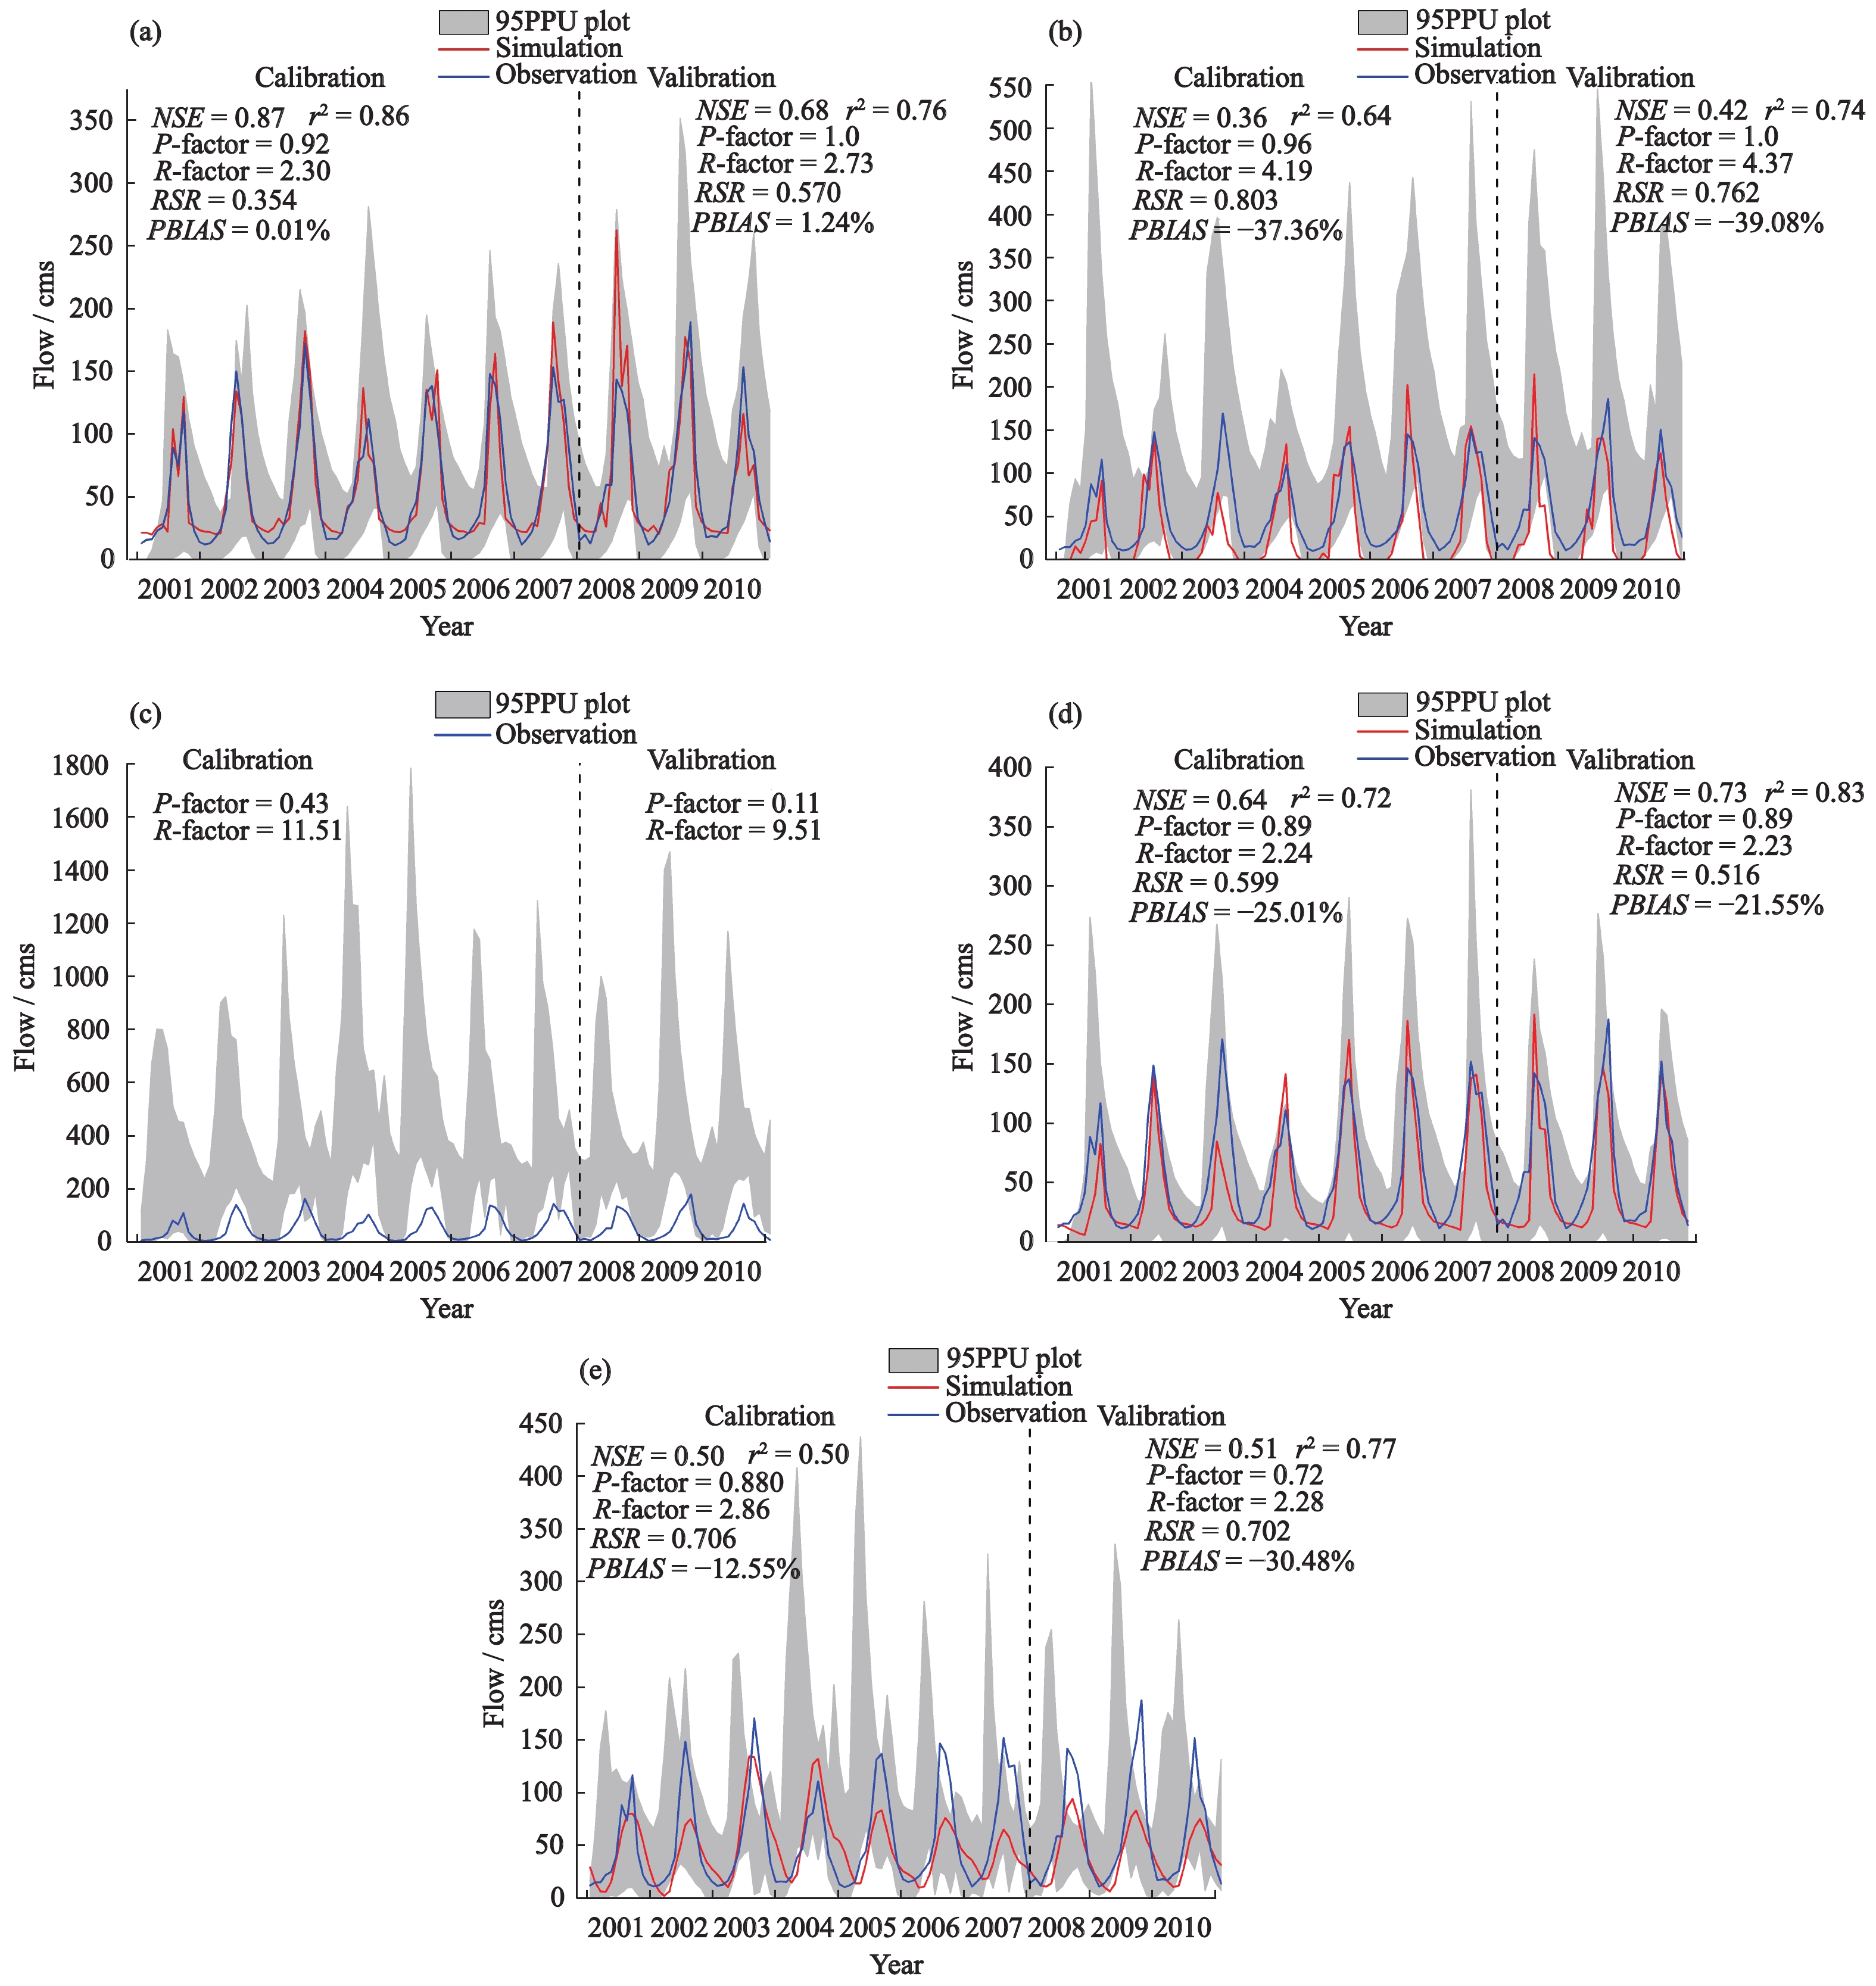
As TMPA-driven simulations tend to yield an unsatisfactory result in the daily discharge simulations (Meng et al., 2014), only the monthly streamflow simulations were compared and evaluated in this study. The gauge dataset performs very well with NSE and r2 of 0.87 and 0.86 in the calibration period, and 0.68 and 0.76 in the validation period, respectively. It indicates that the SWAT model performs quite well in simulating the watershed hydrology in the study area.
Achieving their best performance through calibration, the WRF output performs satisfactorily with the NSE and r2 of 0.36 and 0.64 in the calibration period, and 0.42 and 0.74 in the validation period, respectively. The TMPA product produces unreliable simulation results with negative NSE values in both calibration and validation periods. Therefore, the WRF output is more credible than the TMPA product in hydrological simulations in the study area.
-
As shown in Table 2, the bias-corrected WRF output shows significant performance improvements than the raw WRF output with smaller RSR, MAE, absolute ME and PBIAS values at all the stations. Evaluated at the watershed scale, the RSR, MAE, ME and PBIAS values are 0.999, 0.804 mm, 0.011 mm and 13.6% for the bias-corrected WRF output, respectively, which are also significantly smaller than those of the raw WRF output (1.497, 1.237 mm, 0.706 mm and 89.8%, respectively). With an average annual value of 291.3 mm/yr, the bias-corrected WRF output is much closer to the gauge observations (201.5 mm/yr) than the raw WRF output (604.5 mm/yr). Evaluated by the ME and PBIAS values, the bias-corrected WRF output underestimates precipitation at the gauge stations and overestimates precipitation at the watershed scale in the study area.
As shown in Fig. 6a, the bias-corrected WRF output is drier in the northwest and wetter in the southeast of the study area. Because the raw WRF output shows same spatial pattern with the gauge observations, the bias-corrected WRF output and the raw WRF output show consistent spatial distributions, both well catch the spatial pattern of the precipitation in the study area.

Figure 6. Average annual precipitation of the bias-corrected precipitation datasets in each subbasin in the upper reach of the Heihe River Watershed. (a) Bias-corrected WRF output, (b) Bias-correction TMPA product
By bias correction, the NSE value increases from 0.36 to 0.64 in the calibration period and from 0.42 to 0.73 in the validation period, while the r2 value increases from 0.64 to 0.72 in the calibration period and from 0.74 to 0.83 in the validation period for the WRF output (Fig. 7). According to the performance ratings (Kalin et al., 2010), bias correction upgrades one rating level of the WRF output in hydrological simulations.

Figure 7. Performance of each dataset in driving SWAT model. (a) The Gauge dataset, (b) The WRF output, (c) The TMPA product, (d) The bias-corrected WRF output, (e) The bias-corrected TMPA product. As the NSE values of the TMPA product are negative, only uncertainty analysis factors are shown in the figure
-
As shown in Table 2, the bias-corrected TMPA product also shows significant performance improvements than the raw TMPA product with smaller RSR, MAE, absolute ME and PBIAS values at each station. Evaluated at the watershed scale, the RSR, MAE, ME and PBIAS values are 1.882, 1.470 mm, 0.125 mm and 15.8% for the bias-corrected TMPA product, respectively, which are also significantly smaller than those of the TMPA product (4.378, 3.723 mm, 2.712 mm and 344.8%, respectively). With an average annual value of 332.9 mm/yr, the bias-corrected TMPA product is much closer to the gauge data (201.5 mm/yr) than the raw TMPA product (1276.4 mm/yr). Evaluated by the ME and PBIAS values, the bias-corrected TMPA product underestimates precipitation at the gauge stations and overestimates precipitation at the watershed scale in the study area.
As shown in Fig. 6b, the bias-corrected TMPA product is drier in northwest and southeast and wetter in the middle. Because the raw TMPA product shows different spatial pattern from the gauge observations, the bias-corrected TMPA product and the raw TMPA product show different spatial distributions, and both of them did not reflect the precipitation pattern in the study area.
By bias correction, the NSE value increases from negative value to 0.50 in the calibration period and from negative value to 0.51 in the validation period, while the r2 value increases from 0.05 to 0.50 in the calibration period and from 0.03 to 0.77 in the validation period for the TMPA product (Fig. 7). According to the performance ratings (Kalin et al., 2010), bias correction upgrades two rating levels of the TMPA product in hydrological simulations.
-
As shown in Table 2, the RSR, absolute ME and PBIAS values of the bias-corrected WRF output are all significantly smaller than those of the bias-corrected TMPA product at all the stations. The MAE values of the bias-corrected WRF output are slightly larger than those of the bias-corrected TMPA product at Linze, Zhangye, Shandan and Yongchang, while smaller at all the other stations. Thus, evaluated by the combination of four indictors, the bias-corrected WRF output also fits the observations better than the bias-corrected TMPA product at each station. At the watershed scale, the RSR, MAE, ME and PBIAS values are 0.999, 0.804 mm, 0.011 mm and 13.6% for the bias-corrected WRF output, respectively, and are 1.882, 1.470 mm, 0.125 mm and 15.8% for the bias-corrected TMPA product, respectively. Therefore, the bias-corrected WRF output also performs better than the bias-corrected TMPA product at the watershed scale.
By bias correction, the improvement of the TMPA product in estimating precipitation values is notably larger than the WRF output at point scale and at watershed scale. Furthermore, as shown in Fig. 7, with bias-correction, the performance improvements the TMPA product is also significantly larger than the WRF output in hydrological simulations.
-
The mismatch between continuously accumulating point-scale gauge observations and snapshot areal satellite precipitation has a marked impact on evaluation results (Tang et al., 2018). Nevertheless, all the datasets were evaluated by same methods in this study, thus the comparison results of different datasets are credible. Evaluated against the sparse gauge observations at daily scale, it could be difficult to judge whether precipitation datasets overestimate or underestimate precipitation in a domain by regular BIAS values (Tang et al., 2018). However, in this study, the extreme large PBIAS values of the WRF output and the TMPA product indicate that both datasets overestimate precipitation in the study area. Both bias-corrected datasets underestimate precipitation at the gauge stations and overestimate precipitation at the watershed scale in the study area. According to the value extents of PBIAS, the reliable result is that the bias-corrected WRF output underestimates precipitation at the gauge stations and the bias-corrected TMPA product overestimates precipitation at the watershed scale. Because of the differences in evaluations at gauge stations and at the watershed scale, it is difficult to determine the overestimation or underestimations of both bias-corrected datasets.
-
It is necessary to evaluate the hydrological applications of different precipitation datasets by uncertainty analysis (Zhu et al., 2018). Generally, the simulation uncertainty includes model uncertainty, parameter uncertainty and input uncertainty (Beven and Binley, 1992). In this study, for each dataset, the default ranges of 23 parameters in the SWAT model were divided into 1800 parameter sets to simulate and then analyze the uncertainty. As shown in Fig. 7, for the gauge dataset, the P-factor values are 0.92 and 1.0 in the calibration and validation periods, respectively, indicating that the model error (1 – P-factor) is very small in the study area. Thus, the simulation driven by the gauge dataset was used as the reference in this study.
As shown in Fig. 7, compared to the gauge dataset, the WRF output shows slightly larger uncertainty with similar P-factor values and larger R-factor values, while the TMPA product is unreliable with extreme smaller P-factor values and extreme larger R-factor values in both the calibration and validation periods. The bias-corrected WRF output is more reliable than the gauge dataset with slightly smaller P-factor values and smaller R-factor values in both periods, and the bias-corrected TMPA product shows greater uncertainty than the gauge dataset with smaller P-factor values and similar R-factor values (Fig. 7). Thus, the better simulation performance of a dataset, the smaller the uncertainty in this study. Moreover, by bias correction, the uncertainty reduction of the TMPA product is significantly larger than the WRF output (Fig. 7).
The WRF output underestimates precipitation in winter (Fig. 7), it is because the calibrated parameters are suitable for normal conditions, resulting in the underestimations under small precipitation amounts in winter (Zhang et al., 2016). The bias-corrected TMPA overestimates in summer (Fig. 7), this is also because the calibrated parameters are suitable for normal conditions, the large precipitation amounts in summer cause overestimations. Thus, it should be cautious in the evaluation of within annual variations of different datasets by hydrological simulations.
-
The WRF output performs better than the TMPA product in both estimating precipitation amount and detecting precipitation events in the study area. Moreover, the WRF output also shows satisfactory performance with slightly larger uncertainty than the gauge dataset in hydrological simulations, while the TMPA product produces unreliable simulation results. This is consistent with most previous studies, which pointed out that the atmospheric reanalysis datasets performed better than the satellite products (Ebert et al., 2007; Mourre et al., 2016; Beck et al., 2017). But Seyyedi et al. (2014) found that satellite product performed better than reanalysis product in a basin with latitudes ranging from 39°N to 43°N. It is because the study area in Seyyedi et al. (2014) is very flat ranging from 22 m below sea level to 949 m above sea level, but the other studies focus on areas with greatly fluctuating terrain, such as three upper catchments of the Volta River Basin in Central Africa (0–3600 m asl) (Thiemig et al., 2013), the Tibetan plateau (Tong et al., 2014), Mainland China (Li et al., 2018), and over the globe (Beck et al., 2017). Therefore, atmospheric reanalysis datasets are more suitable than the satellite products in high mountainous areas.
Impacted by complex topography and terrain in high mountainous areas, the simulation resolution is a more important factor influencing the performance in estimating precipitation of the WRF output than the sub-mesh parameterizations (Mourre et al., 2016). With a finer resolution of 0.05° × 0.05° at hourly step, the WRF output performs better than the TMPA product in the upper reach of the Heihe River Watershed. Also because of the finer simulation resolution, the WRF output overestimates precipitation at the watershed scale in this study (Mourre et al., 2016).
Based on this study and previous researches, the TMPA product is unreliable with overestimations in high mountainous areas (Meng et al., 2014; Tang et al., 2016). In the upper reach of the Heihe River Watershed, ‘falseAlarms’ events are a main reason for the overestimations of the TMPA product, and there is a systemic error of ‘falseAlarms’ events of the TMPA product. The previous studies pointed out that high systematic FAR value could be related to altitude effect in mountain regions (AghaKouchak et al., 2012; Nasrollahi et al., 2013; Qin et al., 2014). However, the FAR values are 0.2–0.4 in Iran with high elevation of 0–5597 m asl (Darand et al., 2017), and 0.205–0.285 in North India with high elevation of 300–7000 m asl (Bharti and Singh, 2015), while 0.540–0.990 in the Betwa River basin in central India with low elevation of 91–706 m asl (Kumar et al., 2017). It indicates that altitude effect is not the main reason for high FAR values. As shown in Table 4, the FAR values of the TRMM product are low with range of 0.130–0.285 in humid areas, while high with range of 0.380–0.990 in subhumid areas, and with range of 0.450–0.870 in semiarid areas, respectively. Therefore, climate is more important than altitude for the ‘falseAlarms’ of the TRMM product. Therefore, as a mission focusing on the tropical areas, the TMPA product mistakes certain meteorological situations for precipitation in subhumid and semiarid areas, causing significant ‘falseAlarms’ events and leading to significant overestimations and unreliable performance. This also causes the systematic differences in detecting precipitation events between the WRF output and the TMPA product, partially leading to better performance of the WRF output.
Table 4. The FAR values of the TRMM product in previous studies
No. FAR values Study area Location Elevation / m asl Climate Annual precipitation / mm Reference 1 0.136–0.188 Lake Victoria Watershed in East Africa 34.00°E–36.00°E,
0.05°N–1.25°N1134–2700 Humid 1350 Li et al., 2009b 2 0.200–0.800 Mahanadi River Watershed in the
Eastern part of India80.50°E–86.83°E,
19.33°N–23.58°N–457 Humid 1500 Kneis et al., 2014 3 0.205–0.285 Himachal Pradesh (HP) and
Uttarakhand (UK) in India77.50°E–81.50°E,
28.50°N–31.50°N300–7000 Humid 1178.23 mm in HP and 1494.72 mm
in UK for monsoon season (June–September)Bharti and Singh, 2015 4 0.209–0.457 Dongjiang River Watershed in China 113.42°E–115.82°E,
22.47°N–25.23°N< 1500 Humid 1500–2400 Chen et al., 2011 5 0.140––0.160 Xiangjiang River Watershed and Qujiang River Watershed, in middle China 110.50°E–114.25°E,
24.50°N–28.25°N1–over 2000 Humid 1400–1700 Zhu et al., 2016 6 0.130 Mishui Watershed in South China 112.85°E–114.20°E,
26.00°N–27.20°N49–2093 Humid 1561 Jiang et al., 2012 7 0.540–0.990 The Betwa River Watershed in central
part of India77.17°E–80.33°E,
22.90°N–26.08°N91–706 Subhumid 700–1200 Kumar et al., 2017 8 0.380–0.470 Huifa River Watershed in the northeast of China 125.00°E–126.80°E,
41.50°N–43.50°N172–1391 Subhumid about 776 Zhu et al., 2018 9 0.450–0.770 Middle and upper reaches of Heihe River Watershed 98.50°E–102.00°E,
37.50°N–40.00°N1277–5072 Semiarid 140–700 Peng et al., 2014 10 0.584–0.870 Upper reaches of the Heihe River Watershed 98.50°E–100.49°E,
37.50°N–38.51°N1674–5584 Semiarid 250–700 This study 11 < 0.100–0.700 The La Plata Basin in South America 43.00°W–67.00°W,
14.00°S–38.00°Sabout 200–1000 – 20–1800 Su et al., 2008 12 0.200–0.400 Iran 44.00°E–64.00°E,
25.00°N–40.00°N0–5597 – < 100–1800 Darand et al., 2017 13 0–0.410 Greece 10.00°E–35.00°E,
32.00°N–44.00°N0.8–1500 – 400–1200 Nastos et al., 2016 14 0.340–0.400 China* 73.55°E–135.08°E,
3.85°N–53.55°N154–8844 – 20–1600 Qin et al., 2014 Note: FAR refers to false alarm ratio; * Not include Hong Kong, Macao and Taiwan of China In the upper reach of the Heihe River Watershed, the impacts of ‘falseAlarms’ events show significant seasonal differences. The TMPA product performs poorly in snow-covered area and glaciers as ice on the ground behaves in a similar way as rain or ice drops in the atmosphere in terms of scattering the microwave energy (Yin et al., 2004; Mourre et al., 2016). In the upper reach of the Heihe River Watershed, the precipitation is snow and sleet in winter, and the snow-coverage reaches its largest area in winter and smallest in summer during the year (Bourque and Mir, 2012). Moreover, there are 800 glaciers with an area of 361.69 km2 in the study area (Huai et al., 2014). Thus, because of the impacts of snow-covered areas and glaciers, the ‘falseAlarms’ events show significant seasonal differences and lead to extremely poor performance of the TMPA product in winter in the upper reach of the Heihe River Watershed.
-
Simple linear bias correction method significantly improves the capabilities in estimating precipitation values of both the WRF output and the TMPA product at the point scale and at the watershed scale. It indicates that removing systematical errors can significantly improve precipitation estimations in arid high mountainous areas with data scarcity. Evaluated by hydrological simulations, the bias-corrected WRF output is more reliable than the gauge dataset. Thus, data merging of the WRF output and gauge observations would provide more reliable precipitation estimations in arid high mountainous areas. The improvement of the TMPA product is notably larger than the WRF output. This is because the larger correlation coefficients between biases and estimated precipitation of the TMPA product lead to better improvements by linear bias correction method (Fig. 2), and then resulting better improvements and larger uncertainty reduction of the TMPA product in hydrological simulations.
-
In this study, two popular kinds of precipitation datasets, the reanalysis product downscaled by RCM (the WRF output) and the satellite product (the TMPA product) were evaluated and compared in the upper reach of the Heihe River Watershed, located in the middle Qilian mountain, in Northwest China. Moreover, both datasets were bias-corrected and compared. The evaluations were carried out both against the ground observations and through hydrological simulations by the SWAT model. The main conclusions are as follows.
(1) Although evaluated against the sparse gauge observations, it is convincing that the WRF output with finer resolution performs well in both estimating precipitation and hydrological simulation, while the TMPA product is unreliable in high mountainous areas. Moreover, bias-corrected WRF output also performs better than bias-corrected TMPA product. Combined with the previous studies, atmospheric reanalysis datasets are more suitable than satellite products in high mountainous areas.
(2) Climate is more important than altitude for the ‘falseAlarms’ events of the TRMM product. Designed to focus on the tropical areas, the TMPA product mistakes certain meteorological situations for precipitation in subhumid and semiarid areas, thus causing significant ‘falseAlarms’ events and leading to significant overestimations and unreliable performance. This also causes the systemic difference in detecting precipitation events between the WRF output and the TMPA product, partially leading to better performance of the WRF output. Moreover, because of the impacts of snow-covered areas and glaciers, the ‘falseAlarms’ events show significant seasonal differences and lead to extremely poor performance of the TMPA product in winter in the upper reach of the Heihe River Watershed.
(3) ‘FalseAlarms’ events are over three times more than ‘hits’ events when estimated precipitation values larger than 0.285 mm for the WRF output, and estimated precipitation values larger than 0.597 mm for the TMPA product, which should be cautioned in the future applications.
(4) Simple linear bias correction method significantly improves the accuracy of both the WRF output and the TMPA product in estimating precipitation values, indicating that only removing systematical errors can significantly improve precipitation estimations in arid high mountainous areas with data scarcity. Evaluated by hydrological simulations, the bias-corrected WRF output is more reliable than the gauge dataset. Thus, data merging of the WRF output and gauge observations would provide more reliable precipitation estimations in arid high mountainous areas.
The conclusions in this study are useful to improve the regional climate models and satellite products in high mountainous areas, especially for the improvement of the continuous project of the TRMM, the Global Precipitation Measurement (GPM) project. With significant improvements, bias correction is an effective way for data merge of different precipitation datasets in arid high mountainous areas, which should be get more attentions and be improved in future studies.
Evaluation of Precipitation Datasets from TRMM Satellite and Downscaled Reanalysis Products with Bias-correction in Middle Qilian Mountain, China
-
Abstract: Accurate estimates of precipitation are fundamental for hydrometeorological and ecohydrological studies, but are more difficult in high mountainous areas because of the high elevation and complex terrain. This study compares and evaluates two kinds of precipitation datasets, the reanalysis product downscaled by the Weather Research and Forecasting (WRF) output, and the satellite product, the Tropical Rainfall Measuring Mission (TRMM) Multisatellite Precipitation Analysis (TMPA) product, as well as their bias-corrected datasets in the Middle Qilian Mountain in Northwest China. Results show that the WRF output with finer resolution performs well in both estimating precipitation and hydrological simulation, while the TMPA product is unreliable in high mountainous areas. Moreover, bias-corrected WRF output also performs better than bias-corrected TMPA product. Combined with the previous studies, atmospheric reanalysis datasets are more suitable than the satellite products in high mountainous areas. Climate is more important than altitude for the ‘falseAlarms’ events of the TRMM product. Designed to focus on the tropical areas, the TMPA product mistakes certain meteorological situations for precipitation in subhumid and semiarid areas, thus causing significant ‘falseAlarms’ events and leading to significant overestimations and unreliable performance. Simple linear bias correction method, only removing systematical errors, can significantly improves the accuracy of both the WRF output and the TMPA product in arid high mountainous areas with data scarcity. Evaluated by hydrological simulations, the bias-corrected WRF output is more reliable than the gauge dataset. Thus, data merging of the WRF output and gauge observations would provide more reliable precipitation estimations in arid high mountainous areas.
-
Figure 2. Scatterplots of biases and the precipitation values in the upper reach of the Heihe River Watershed. (a) The WRF (Weather Research and Forecasting) output, (b) The TMPA (Tropical Rainfall Measuring Mission (TRMM) Multisatellite Precipitation Analysis) product
Figure 3. Average annual precipitation of both raw datasets in each subbasin in the upper reach of the Heihe River Watershed. (a) The WRF output, (b) The TMPA product
Figure 4. Contingency analysis at gauge stations. (a) The WRF output, (b) The TMPA product. POD refers to probability of detection, FAR refers to false alarm ratio, CSI refers to critical success index
Figure 5. Categorical analysis based on the estimated precipitation datasets. (a) RSR values of the WRF output, (b) RSR values of the TMPA product, (c) POD values of the WRF output, (d) POD values of the TMPA product. Q5, Q25, Q50, Q75, and Q95 are listed in Table 3 for each dataset. RSR refers to the ratio of root-mean-square errors to the observations’ standard deviation, POD refers to probability of detection, FAR refers to false alarm ratio, CSI refers to critical success index
Figure 6. Average annual precipitation of the bias-corrected precipitation datasets in each subbasin in the upper reach of the Heihe River Watershed. (a) Bias-corrected WRF output, (b) Bias-correction TMPA product
Figure 7. Performance of each dataset in driving SWAT model. (a) The Gauge dataset, (b) The WRF output, (c) The TMPA product, (d) The bias-corrected WRF output, (e) The bias-corrected TMPA product. As the NSE values of the TMPA product are negative, only uncertainty analysis factors are shown in the figure
Table 1. Major datasets used in the initial setup of the SWAT in the upper reach of the Heihe River Watershed
Data Resolution Period Source agency Precipitation (gauge observations) Daily, nine stations 2000–2010 The National Meteorological Center of China (NMCC) Precipitation (WRF output) Hourly, 0.05° × 0.05° 2000–2010 Environmental & Ecological Science Data Center for West China, National
Natural Science Foundation of China (http://westdc.westgis.ac.cn )Precipitation (bias-corrected WRF output) Daily, 0.05° × 0.05° 2000–2010 This study Precipitation (TMPA product) Daily, 0.25° × 0.25° 2000–2010 National Aeronautics and Space Administration
(https://pmm.nasa.gov/index.php?q=TRMM )Precipitation (bias-corrected TMPA product) Daily, 0.25° × 0.25° 2000–2010 This study Air temperature (maximum, minimum) Daily, nine stations Solar radiation Daily, nine stations 2000–2010 The National Meteorological Center of China (NMCC) Wind Daily, nine stations Relative humidity Daily, nine stations Flow data Daily runoff 2000–2010 DEM 30 m Environmental & Ecological Science Data Center for West China, National Natural Science Foundation of China ( http://westdc.westgis.ac.cn )Soil data 1∶1 000 000 2000 Land use data 1∶100 000 2000 Notes: WRF: Weather Research and Forecasting; TMPA: Tropical Rainfall Measuring Mission (TRMM) Multisatellite Precipitation Analysis; DEM is Digital Elevation Model  下载: 导出CSV
Table 2. Comparison of the precipitation values from different datasets with the gauge observations at daily step in the middle Qilian Mountain, China
Datasets Statistics Linze Tuole Sunan Yeniugou Zhangye Minle Qilian Shandan Yongchang WRF output RSR 1.403 1.125 1.848 1.240 1.701 1.308 1.394 2.414 2.285 MAE / mm 0.452 1.118 1.148 1.546 0.917 1.485 1.713 2.413 2.063 ME / mm 0.140 –0.105 0.577 –0.155 0.485 0.474 0.133 1.783 1.433 PBIAS / % 57.4 –11.0 99.5 –11.7 111.8 52.3 10.7 268.4 209.8 TMPA product RSR 7.350 3.210 5.106 3.028 5.142 3.006 2.954 3.536 3.856 MAE / mm 3.635 3.981 4.096 4.313 3.616 3.707 4.110 3.498 3.425 ME / mm 3.259 2.525 3.211 2.325 2.960 2.241 2.102 2.410 2.323 PBIAS / % 1338.6 264.3 553.4 175.9 681.6 247.2 169.4 362.7 340.1 Bias-corrected WRF output RSR 0.934 0.911 0.915 0.910 0.917 0.934 0.953 0.971 0.965 MAE / mm 0.309 1.056 0.680 1.349 0.540 1.103 1.415 0.945 0.934 ME / mm –0.068 –0.224 –0.113 –0.338 –0.061 –0.119 –0.258 –0.072 –0.059 PBIAS / % –27.7 –23.4 –19.5 –25.5 –14.1 –13.1 –20.8 –10.9 –8.7 Bias-corrected TMPA product RSR 1.012 1.032 1.026 1.039 1.018 1.025 1.040 1.019 1.027 MAE / mm 0.307 1.162 0.705 1.580 0.536 1.111 1.446 0.823 0.824 ME / mm –0.164 –0.583 –0.378 –0.692 –0.287 –0.583 –0.770 –0.414 –0.452 PBIAS / % –67.3 –61.0 –65.1 –52.3 –66.1 –64.3 –62.1 –62.3 –66.2 Notes: RSR refers to the ratio of root-mean-square errors to the observations’ standard deviation, MAE refers to mean absolute error, ME refers to mean of error, PBIAS refers to percentage bias
下载: 导出CSV
Table 3. Five percentile points of three precipitation datasets
Percentile points Gauge dataset / mm The WRF output / mm The TMPA product / mm Q5 0.61 0.285 0.597 Q25 4.90 1.589 3.022 Q50 11.70 4.068 7.754 Q75 19.40 9.224 17.462 Q95 30.00 22.642 42.381 Notes: Q5 is 5 percentile, Q25 is 25 percentile, Q50 is 50 percentile, Q75 is 75 percentile, and Q95 is 95 percentile, respectively
下载: 导出CSV
Table 4. The FAR values of the TRMM product in previous studies
No. FAR values Study area Location Elevation / m asl Climate Annual precipitation / mm Reference 1 0.136–0.188 Lake Victoria Watershed in East Africa 34.00°E–36.00°E,
0.05°N–1.25°N1134–2700 Humid 1350 Li et al., 2009b 2 0.200–0.800 Mahanadi River Watershed in the
Eastern part of India80.50°E–86.83°E,
19.33°N–23.58°N–457 Humid 1500 Kneis et al., 2014 3 0.205–0.285 Himachal Pradesh (HP) and
Uttarakhand (UK) in India77.50°E–81.50°E,
28.50°N–31.50°N300–7000 Humid 1178.23 mm in HP and 1494.72 mm
in UK for monsoon season (June–September)Bharti and Singh, 2015 4 0.209–0.457 Dongjiang River Watershed in China 113.42°E–115.82°E,
22.47°N–25.23°N< 1500 Humid 1500–2400 Chen et al., 2011 5 0.140––0.160 Xiangjiang River Watershed and Qujiang River Watershed, in middle China 110.50°E–114.25°E,
24.50°N–28.25°N1–over 2000 Humid 1400–1700 Zhu et al., 2016 6 0.130 Mishui Watershed in South China 112.85°E–114.20°E,
26.00°N–27.20°N49–2093 Humid 1561 Jiang et al., 2012 7 0.540–0.990 The Betwa River Watershed in central
part of India77.17°E–80.33°E,
22.90°N–26.08°N91–706 Subhumid 700–1200 Kumar et al., 2017 8 0.380–0.470 Huifa River Watershed in the northeast of China 125.00°E–126.80°E,
41.50°N–43.50°N172–1391 Subhumid about 776 Zhu et al., 2018 9 0.450–0.770 Middle and upper reaches of Heihe River Watershed 98.50°E–102.00°E,
37.50°N–40.00°N1277–5072 Semiarid 140–700 Peng et al., 2014 10 0.584–0.870 Upper reaches of the Heihe River Watershed 98.50°E–100.49°E,
37.50°N–38.51°N1674–5584 Semiarid 250–700 This study 11 < 0.100–0.700 The La Plata Basin in South America 43.00°W–67.00°W,
14.00°S–38.00°Sabout 200–1000 – 20–1800 Su et al., 2008 12 0.200–0.400 Iran 44.00°E–64.00°E,
25.00°N–40.00°N0–5597 – < 100–1800 Darand et al., 2017 13 0–0.410 Greece 10.00°E–35.00°E,
32.00°N–44.00°N0.8–1500 – 400–1200 Nastos et al., 2016 14 0.340–0.400 China* 73.55°E–135.08°E,
3.85°N–53.55°N154–8844 – 20–1600 Qin et al., 2014 Note: FAR refers to false alarm ratio; * Not include Hong Kong, Macao and Taiwan of China
下载: 导出CSV
-
[1] Abbaspour K C, Rouholahnejad E, Vaghefi S et al., 2015. A continental-scale hydrology and water quality model for Europe: calibration and uncertainty of a high-resolution large-scale SWAT model. Journal of Hydrology, 524: 733–752. doi: 10.1016/j.jhydrol.2015.03.027 [2] AghaKouchak A, Mehran A, Norouzi H et al., 2012. Systematic and random error components in satellite precipitation data sets. Geophysical Research Letters, 39(9): L09406. doi: 10.1029/2012GL051592 [3] Beck H E, Vergopolan N, Pan M et al., 2017. Global-scale evaluation of 22 precipitation datasets using gauge observations and hydrological modeling. Hydrology and Earth System Sciences, 21(12): 6201–6217. doi: 10.5194/hess-21-6201-2017 [4] Behrangi A, Khakbaz B, Jaw T C et al., 2011. Hydrologic evaluation of satellite precipitation products over a mid-size basin. Journal of Hydrology, 397(3–4): 225–237. doi: 10.1016/j.jhydrol.2010.11.043 [5] Beven K, Binley A, 1992. The future of distributed models: model calibration and uncertainty prediction. Hydrological Processes, 6(3): 279–298. doi: 10.1002/hyp.3360060305 [6] Bharti V, Singh C, 2015. Evaluation of error in TRMM 3B42V7 precipitation estimates over the Himalayan region. Journal of Geophysical Research, 120(24): 12458–12473. doi: 10.1002/2015JD023779 [7] Bitew M M, Gebremichael M, 2011. Evaluation of satellite rainfall products through hydrologic simulation in a fully distributed hydrologic model. Water Resources Research, 47(6): W06526. doi: 10.1029/2010WR009917 [8] Bourque C P A, Mir M A, 2012. Seasonal snow cover in the Qilian Mountains of Northwest China: its dependence on oasis seasonal evolution and lowland production of water vapour. Journal of Hydrology, 454–455: 141–151. doi: 10.1016/j.jhydrol.2012.06.008 [9] Chen C, Yu Z, Li L et al., 2011. Adaptability ealuation of TRMM satellite rainfall and its application in the Dongjiang River Basin. Procedia Environmental Sciences, 10: 396–402. doi: 10.1016/j.proenv.2011.09.065 [10] Chen J, Brissette F P, Chaumont D et al., 2013. Finding appropriate bias correction methods in downscaling precipitation for hydrologic impact studies over North America. Water Resources Research, 49(7): 4187–4205. doi: 10.1002/wrcr.2033 [11] Chen J, Li C, Brissette F P et al., 2018. Impacts of correcting the inter-variable correlation of climate model outputs on hydrological modeling. Journal of Hydrology, 560: 326–341. doi: 10.1016/j.jhydrol.2018.03.040 [12] Darand M, Amanollahi J, Zandkarimi S, 2017. Evaluation of the performance of TRMM Multi-satellite Precipitation Analysis (TMPA) estimation over Iran. Atmospheric Research, 190: 121–127. doi: 10.1016/j.atmosres.2017.02.011 [13] Ding Yongjian, Ye Baisheng, Zhou Wenjuan, 1999. Temporal and spatial precipitation distribution in the Heihe catchment, Northwest China, during the past 40 a. Journal of Glaciolgy and Geocryology, 21(1): 42–48. (in Chinese) [14] Ebert E E, Janowiak J E, Kidd C, 2007. Comparison of near-real-time precipitation estimates from satellite observations and numerical models. Bulletin of the American Meteorological Society, 88(1): 47–64. doi: 10.1175/BAMS88147 [15] Essou G R C, Sabarly F, Lucas-Picher P et al., 2016. Can precipitation and temperature from meteorological reanalyses be used for hydrological modeling? Journal of Hydrometeorology, 17(7): 1929–1950. doi: 10.1175/JHM-D-15-0138.1 [16] Ghajarnia N, Liaghat A, Arasteh P D, 2015. Comparison and evaluation of high resolution precipitation estimation products in Urmia Basin-Iran. Atmospheric Research, 158–159: 50–65. doi: 10.1016/j.atmosres.2015.02.010 [17] Gudmundsson L, Tallaksen L M, Stahl K et al., 2012. Comparing large-scale hydrological model simulations to observed runoff percentiles in Europe. Journal of Hydrometeorology, 13(2): 604–620. doi: 10.1175/jhm-d-11-083.1 [18] Henn B, Newman A J, Livneh B et al., 2018. An assessment of differences in gridded precipitation datasets in complex terrain. Journal of Hydrology, 556: 1205–1219. doi: 10.1016/j.jhydrol.2017.03.008 [19] Huai B J, Li Z Q, Wang S J et al., 2014. RS analysis of glaciers change in the Heihe River Basin, Northwest China, during the recent decades. Journal of Geographical Sciences, 24(6): 993–1008. doi: 10.1007/s11442-014-1133-z [20] Huffman G J, Bolvin D T, Nelkin E J et al., 2007. The TRMM multisatellite precipitation analysis (TMPA): quasi-global, multiyear, combined-sensor precipitation estimates at fine scales. Journal of Hydrometeorology, 8(1): 38–55. doi: 10.1175/JHM560.1 [21] Huffman G J, Bolvin D T, 2018. Real-Time TRMM Multi-Satellite Precipitation Analysis Data Set Documentation. Available at: https://pmm.nasa.gov/sites/default/files/document_files/3B4XRT_doc_V7_180426.pdf [22] Jiang S H, Ren L L, Hong Y et al., 2012. Comprehensive evaluation of multi-satellite precipitation products with a dense rain gauge network and optimally merging their simulated hydrological flows using the Bayesian model averaging method. Journal of Hydrology, 452–453: 213–225. doi: 10.1016/j.jhydrol.2012.05.055 [23] Kalin L, Isik S, Schoonover J E et al., 2010. Predicting water quality in unmonitored watersheds using artificial neural networks. Journal of Environmental Quality, 39(4): 1429–1440. doi: 10.2134/jeq2009.0441 [24] Kneis D, Chatterjee C, Singh R, 2014. Evaluation of TRMM rainfall estimates over a large Indian river basin (Mahanadi). Hydrology and Earth System Sciences, 18: 2493–2502. doi: 10.5194/hess-18-2493-2014 [25] Kumar D, Gautam A K, Palmate S S et al., 2017. Evaluation of TRMM multi-satellite precipitation analysis (TMPA) against terrestrial measurement over a humid sub-tropical basin, India. Theoretical and Applied Climatology, 129(3–4): 783–799. doi: 10.1007/s00704-016-1807-9 [26] Lafon T, Dadson S, Buys G et al., 2013. Bias correction of daily precipitation simulated by a regional climate model: a comparison of methods. International Journal of Climatology, 33(6): 1367–1381. doi: 10.1002/joc.3518 [27] Li C M, Tang G Q, Hong Y, 2018. Cross-evaluation of ground-based, multi-satellite and reanalysis precipitation products: applicability of the triple collocation method across mainland China. Journal of Hydrology, 562: 71–83. doi: 10.1016/j.jhydrol.2018.04.039 [28] Li L, Hong H, Wang J H et al., 2009b. Evaluation of the real-time TRMM-based multi-satellite precipitation analysis for an operational flood prediction system in Nzoia Basin, Lake Victoria, Africa. Natural Hazards, 50: 109–123. doi: 10.1007/s11069-008-9324-5 [29] Li Z L, Xu Z X, Shao Q X et al., 2009a. Parameter estimation and uncertainty analysis of SWAT model in upper reaches of the Heihe river basin. Hydrological Processes, 23(19): 2744–2753. doi: 10.1002/hyp.7371 [30] Ma Y Z, Yang Y, Han Z Y et al., 2018. Comprehensive evaluation of Ensemble Multi-Satellite Precipitation Dataset using the Dynamic Bayesian Model Averaging scheme over the Tibetan plateau. Journal of Hydrology, 556: 634–644. doi: 10.1016/j.jhydrol.2017.11.050 [31] Marques J E, Samper J, Pisani B et al., 2011. Evaluation of water resources in a high-mountain basin in Serra da Estrela, Central Portugal, using a semi-distributed hydrological model. Environmental Earth Sciences, 62(6): 1219–1234. doi: 10.1007/s12665-010-0610-7 [32] Maurer E P, Das T, Cayan D R, 2013. Errors in climate model daily precipitation and temperature output: time invariance and implications for bias correction. Hydrology and Earth System Sciences Discussions, 10: 1657–1691. doi: 10.5194/hessd-10-1657-2013 [33] Meng J, Li L, Hao Z C et al., 2014. Suitability of TRMM satellite rainfall in driving a distributed hydrological model in the source region of Yellow River. Journal of Hydrology, 509: 320–332. doi: 10.1016/j.jhydrol.2013.11.049 [34] Moriasi D N, Arnold J G, Van Liew M W et al., 2007. Model evaluation guidelines for systematic quantification of accuracy in watershed simulations. American Society of Agricultural and Biological Engineers, 50(3): 885–900. doi: 10.13031/2013.23153 [35] Mourre L, Condom T, Junquas C et al., 2016. Spatio-temporal assessment of WRF, TRMM and in situ precipitation data in a tropical mountain environment (Cordillera Blanca, Peru). Hydrology and Earth System Sciences, 20(1): 125–141. doi: 10.5194/hess-20-125-2016 [36] Nasrollahi N, Hsu K, Sorooshian S, 2013. An artificial neural network model to reduce false alarms in satellite precipitation products using MODIS and CloudSat observations. Journal of Hydrometeorology, 14(6): 1872–1883. doi: 10.1175/JHM-D-12-0172.1 [37] Nastos P T, Kapsomenakis J, Philandras K M, 2016. Evaluation of the TRMM 3B43 gridded precipitation estimates over Greece. Atmospheric Research, 169: 497–514. doi: 10.1016/j.atmosres.2015.08.008 [38] Nguyen H, Mehrotra R, Sharma A, 2017. Can the variability in precipitation simulations across GCMs be reduced through sensible bias correction? Climate Dynamics, 49(9): 3257–3275. doi: 10.1007/s00382-016-3510-z [39] Nkiaka E, Nawaz N R, Lovett J C, 2017. Evaluating global reanalysis precipitation datasets with rain gauge measurements in the Sudano-Sahel region: case study of the Logone catchment, Lake Chad Basin. Meteorological Applications, 24(1): 9–18. doi: 10.1002/met.1600 [40] Pan X D, Li X, Shi X K et al., 2012. Dynamic downscaling of near-surface air temperature at the basin scale using WRF-a case study in the Heihe River Basin, China. Frontiers of Earth Science, 6(3): 314–323. doi: 10.1007/s11707-012-0306-2 [41] Peng B, Shi J C, Ni-Meister W et al., 2014. Evaluation of TRMM Multisatellite Precipitation Analysis (TMPA) Products and Their Potential Hydrological Application at an Arid and Semiarid Basin in China. IEEE Journal of Selected Topics in Applied Earth Observations and Remote Sensing, 7(9): 3915–3930. doi: 10.1109/JSTARS.2014.2320756 [42] Qin Y X, Chen Z Q, Shen Y et al., 2014. Evaluation of satellite rainfall estimates over the Chinese mainland. Remote Sensing, 6(11): 11649–11672. doi: 10.3390/rs61111649 [43] Rienecker M M, Suarez M J, Todling R et al., 2008. The GEOS-5 Data Assimilation System-Documentation of versions 5.0.1, 5.1.0, and 5.2.0. https://ntrs.nasa.gov/api/citations/20120011955/downloads/20120011955.pdf [44] Seyyedi H, Anagnostou E N, Beighley E et al., 2014. Satellite-driven downscaling of global reanalysis precipitation products for hydrological applications. Hydrology and Earth System Sciences, 18(12): 5077–5091. doi: 10.5194/hess-18-5077-2014 [45] Simmons A, Uppala S, Dee D et al., 2007. ERA-interim: new ECMWF reanalysis products from 1989 onwards. ECMWF Newsletter, 110: 25–35. doi: 10.21957/pocnex23c6 [46] Su F G, Hong Y, Lettenmaier P P, 2008. Evaluation of TRMM Multisatellite Precipitation Analysis (TMPA) and its utility in hydrologic prediction in the La Plata Basin. Journal of hydrometeorology, 9(4): 622–640. doi: 10.1175/2007JHM944.1 [47] Sun Q H, Miao C Y, Duan Q Y et al., 2018. A review of global precipitation data sets: data sources, estimation, and intercomparisons. Reviews of Geophysics, 56(1): 79–107. doi: 10.1002/2017RG000574 [48] Tang G Q, Long D, Hong Y, 2016. Systematic anomalies over inland water bodies of high mountain Asia in TRMM precipitation estimates: no longer a problem for the GPM era? IEEE Geoscience and Remote Sensing Letters, 13(12): 1762–1766. doi: 10.1109/LGRS.2016.2606769 [49] Tang G Q, Behrangi A, Long D et al., 2018. Accounting for spatiotemporal errors of gauges: a critical step to evaluate gridded precipitation products. Journal of Hydrology, 559: 294–306. doi: 10.1016/j.jhydrol.2018.02.057 [50] Tapiador F J, Turk F J, Petersen W et al., 2012. Global precipitation measurement: methods, datasets and applications. Atmospheric Research, 104–105: 70–97. doi: 10.1016/j.atmosres.2011.10.021 [51] Thiemig V, Rojas R, Zambrano-Bigiarini M et al., 2013. Hydrological evaluation of satellite-based rainfall estimates over the Volta and Baro-Akobo Basin. Journal of Hydrology, 499: 324–338. doi: 10.1016/j.jhydrol.2013.07.012 [52] Tong K, Su F G, Yang D Q et al., 2014. Evaluation of satellite precipitation retrievals and their potential utilities in hydrologic modeling over the Tibetan plateau. Journal of Hydrology, 519: 423–437. doi: 10.1016/j.jhydrol.2014.07.044 [53] Viviroli D, Weingartner R, 2004. The Hydrological significance of mountains: from regional to global scale. Hydrology and Earth System Sciences, 8(6): 1017–1030. doi: 10.5194/hess-8-1017-2004 [54] Worqlul A W, Yen H, Collick A S et al., 2017. Evaluation of CFSR, TMPA 3B42 and ground-based rainfall data as input for hydrological models, in data-scarce regions: the upper Blue Nile Basin, Ethiopia. CATENA, 152: 242–251. doi: 10.1016/j.catena.2017.01.019 [55] Yin Z Y, Liu X D, Zhang X Q et al., 2004. Using a geographic information system to improve Special Sensor Microwave Imager precipitation estimates over the Tibetan Plateau. Journal of Geophysical Research, 109(D3): D03110. doi: 10.1029/2003jd003749 [56] Zhang L H, Jin X, He C S et al., 2016. Comparison of SWAT and DLBRM for hydrological modeling of a mountainous watershed in arid Northwest China. Journal of Hydrologic Engineering, 21(5): 04016007. doi: 10.1061/(ASCE)HE.1943-5584.0001313 [57] Zhang L H, He C S, Zhang M M et al., 2019. Evaluation of the SMOS and SMAP soil moisture products under different vegetation types against two sparse in situ networks over arid mountainous watersheds, Northwest China. Science China Earth Sciences, 62(4): 703–718. doi: 10.1007/s11430-018-9308-9 [58] Zhao C Y, Nan Z R, Cheng G D, 2005. Methods for modelling of temporal and spatial distribution of air temperature at landscape scale in the southern Qilian mountains, China. Ecological Modelling, 189(1–2): 209–220. doi: 10.1016/j.ecolmodel.2005.03.016 [59] Zhu H L, Li Y, Huang Y W et al., 2018. Evaluation and hydrological application of satellite-based precipitation datasets in driving hydrological models over the Huifa river basin in Northeast China. Atmospheric Research, 207: 28–41. doi: 10.1016/j.atmosres.2018.02.022 [60] Zhu Q, Xuan W D, Liu L et al., 2016. Evaluation and hydrological application of precipitation estimates derived from PERSIANN-CDR, TRMM 3B42V7, and NCEP-CFSR over humid regions in China. Hydrological Processes, 30(17): 3061–3083. doi: 10.1002/hyp.10846 -

 点击查看大图

计量
- 文章访问数: 103
- HTML全文浏览量: 36
- PDF下载量: 19
- 被引次数: 0


